Analyzing Average Days to Key Actions by Traffic Source
This article is an example of using GA4 data to understand the typical behaviour of users (as in, the time it takes to perform key actions) based on how they first arrived on your website. The full content of this article (including the SQL code) is available for free.
Editor's note: this article is a guest post by Enio Kurtesi, originally published on LinkedIn. It is now also released here in its entirety and its original form without changes, except for some formatting or short additional comments or callouts, or my own screenshots as I tried this out. You can check out Enio's LinkedIn profile here, and through that, a lot of his other work.
Modern e-commerce businesses face several important challenges that this analysis directly addresses. The increasing complexity of customer journeys means that attribution models must account for the reality that customers rarely convert on their first visit. Research consistently shows that customers typically require multiple touchpoints before making a purchase decision.
Marketing budget allocation decisions are often made based on incomplete data. Without understanding the temporal aspects of customer behavior, businesses might underinvest in channels that drive awareness and consideration, while overinvesting in channels that merely capture demand that was generated elsewhere.
The traditional approach of analyzing conversion rates in isolation misses the important dimension of time. A traffic source that shows lower immediate conversion rates might actually be driving high-quality prospects who take longer to convert but ultimately generate higher lifetime value. On the other hand, channels that appear to perform well in short-term metrics might be capturing bottom-funnel traffic that was already influenced by other touchpoints.
When a customer first discovers your website through organic search, how many days typically pass before they add their first item to cart? How does this compare to customers who arrive via paid social media campaigns? These insights are valuable for budget allocation, campaign optimization, and setting realistic expectations for marketing performance.
As an e-commerce analyst, you might find yourself asking these questions:
- Are my paid social campaigns really underperforming, or do they just need more time to convert prospects compared to branded search?
- If organic search visitors take 14 days to purchase while email subscribers convert in 3 days, how should this inform my retargeting strategy?
- Which channels drive customers who make quick purchasing decisions versus those who need extended consideration periods?
- Should I be increasing investment in awareness-driving channels that show longer conversion times but potentially higher lifetime value?"
- Expectation Setting: "What realistic conversion timelines should I communicate to stakeholders for different marketing initiatives?
- Do different traffic sources attract fundamentally different customer behaviors that require specific experiences?
Understanding GA4 Data Structure in BigQuery
When GA4 data is exported to BigQuery, it maintains this event-based structure in a nested format that can initially appear complex to analysts accustomed to traditional relational databases. Each row in the BigQuery export represents a single event, with user-level information, session-level information, and event-specific parameters all contained within the same record structure.
GA4's data export to BigQuery uses a nested structure that efficiently stores complex event data while maintaining query performance. The traffic_source field contains multiple sub-fields including source, medium, and campaign information. When we reference traffic_source.source, we're accessing a specific field within this nested structure. This nested approach allows GA4 to store rich attribution data without requiring separate tables or complex joins. However, it does require analysts to understand the structure and use proper dot notation to access nested fields.
The traffic_source field captures user-scoped acquisition data, representing the source, medium, and campaign associated with a user's first interaction with your property. This attribution is tied to the user. It provides a foundational view of where users originated from at the point of acquisition.

SQL Analysis: Complete Code
WITH first_touch_users AS (
  SELECT
    user_pseudo_id,
    TIMESTAMP_MICROS(MIN(event_timestamp)) AS first_touch_timestamp,
    traffic_source.source AS first_touch_source,
    traffic_source.medium AS first_touch_medium
  FROM `bigquery-public-data.ga4_obfuscated_sample_ecommerce.events_*`
  WHERE
    traffic_source.source IS NOT NULL
    AND traffic_source.medium IS NOT NULL
  GROUP BY user_pseudo_id, traffic_source.source, traffic_source.medium
),


first_add_to_cart AS (
  SELECT
    user_pseudo_id,
    TIMESTAMP_MICROS(MIN(event_timestamp)) AS first_add_to_cart_timestamp
  FROM `bigquery-public-data.ga4_obfuscated_sample_ecommerce.events_*`
  WHERE event_name = 'add_to_cart'
  GROUP BY user_pseudo_id
),


first_purchase AS (
  SELECT
    user_pseudo_id,
    TIMESTAMP_MICROS(MIN(event_timestamp)) AS first_purchase_timestamp
  FROM `bigquery-public-data.ga4_obfuscated_sample_ecommerce.events_*`
  WHERE event_name = 'purchase'
  GROUP BY user_pseudo_id
)


SELECT
  ft.first_touch_source,
  ft.first_touch_medium,
  COUNT(DISTINCT ft.user_pseudo_id) AS total_users,
  AVG(TIMESTAMP_DIFF(atc.first_add_to_cart_timestamp, ft.first_touch_timestamp, DAY)) AS avg_days_to_add_to_cart,
  AVG(TIMESTAMP_DIFF(p.first_purchase_timestamp, ft.first_touch_timestamp, DAY)) AS avg_days_to_purchase,
  STDDEV(TIMESTAMP_DIFF(atc.first_add_to_cart_timestamp, ft.first_touch_timestamp, DAY)) AS stddev_days_to_add_to_cart,
  STDDEV(TIMESTAMP_DIFF(p.first_purchase_timestamp, ft.first_touch_timestamp, DAY)) AS stddev_days_to_purchase
FROM first_touch_users ft
INNER JOIN first_add_to_cart atc ON ft.user_pseudo_id = atc.user_pseudo_id
INNER JOIN first_purchase p ON ft.user_pseudo_id = p.user_pseudo_id
WHERE ft.first_touch_timestamp <= atc.first_add_to_cart_timestamp
  AND atc.first_add_to_cart_timestamp <= p.first_purchase_timestamp
GROUP BY 1, 2
HAVING COUNT(DISTINCT ft.user_pseudo_id) >= 10
ORDER BY avg_days_to_purchase ASC; CASE WHEN statement, if there are too many referral subdomains in your output that are actually the same source. First CTE: first_touch_users
WITH first_touch_users AS (
  SELECT
    user_pseudo_id,
    TIMESTAMP_MICROS(MIN(event_timestamp)) AS first_touch_timestamp,
    traffic_source.source AS first_touch_source,
    traffic_source.medium AS first_touch_medium
  FROM `bigquery-public-data.ga4_obfuscated_sample_ecommerce.events_*`
  WHERE
    traffic_source.source IS NOT NULL
    AND traffic_source.medium IS NOT NULL
  GROUP BY user_pseudo_id, traffic_source.source, traffic_source.medium
),
The first Common Table Expression (CTE) called first_touch_users is designed to identify each user's very first interaction with the website and capture the traffic source information from that initial visit. This CTE extracts the user's pseudo ID,
TIMESTAMP_MICROS(MIN(event_timestamp)) function converts the earliest event_timestamp value into a standard TIMESTAMP format, representing the user's first recorded event in accurate date-time form, and records both the traffic source and medium from their first touchpoint. The query filters the data to include only records where both traffic source and medium information are available, ensuring data quality and completeness.
Second CTE: first_add_to_cart
first_add_to_cart AS (
  SELECT
    user_pseudo_id,
    TIMESTAMP_MICROS(MIN(event_timestamp)) AS first_add_to_cart_timestamp
  FROM `bigquery-public-data.ga4_obfuscated_sample_ecommerce.events_*`
  WHERE event_name = 'add_to_cart'
  GROUP BY user_pseudo_id
),
The second CTE named first_add_to_cart focuses specifically on identifying when each user first added an item to their shopping cart. This CTE scans through all events in the GA4 dataset and filters for events with the name 'add_to_cart', then uses the MIN() aggregate function to find the earliest event_timestamp when each user performed this action.
The GROUP BY clause ensures that each user appears only once in the result set with their earliest add-to-cart date. The result is a clean dataset showing each user's first engagement with the shopping cart functionality, which represents a important milestone in the customer journey as it indicates the transition from browsing to serious purchase consideration.
Third CTE: first_purchase
first_purchase AS (
  SELECT
    user_pseudo_id,
    TIMESTAMP_MICROS(MIN(event_timestamp)) AS first_purchase_timestamp
  FROM `bigquery-public-data.ga4_obfuscated_sample_ecommerce.events_*`
  WHERE event_name = 'purchase'
  GROUP BY user_pseudo_id
)
The third CTE called first_purchase operates similarly to the previous CTE but focuses on the purchase event. This CTE identifies the first time each user completed a purchase by filtering for events named 'purchase' and using MIN() to find the earliest purchase event_timestamp for each user. This represents the final step in the conversion funnel and provides the endpoint for measuring the complete customer journey from first touch to completed transaction.
Main Query Logic
SELECT
  ft.first_touch_source,
  ft.first_touch_medium,
  COUNT(DISTINCT ft.user_pseudo_id) AS total_users,
  AVG(TIMESTAMP_DIFF(atc.first_add_to_cart_timestamp, ft.first_touch_timestamp, DAY)) AS avg_days_to_add_to_cart,
  AVG(TIMESTAMP_DIFF(p.first_purchase_timestamp, ft.first_touch_timestamp, DAY)) AS avg_days_to_purchase,
  STDDEV(TIMESTAMP_DIFF(atc.first_add_to_cart_timestamp, ft.first_touch_timestamp, DAY)) AS stddev_days_to_add_to_cart,
  STDDEV(TIMESTAMP_DIFF(p.first_purchase_timestamp, ft.first_touch_timestamp, DAY)) AS stddev_days_to_purchase
FROM first_touch_users ft
INNER JOIN first_add_to_cart atc ON ft.user_pseudo_id = atc.user_pseudo_id
INNER JOIN first_purchase p ON ft.user_pseudo_id = p.user_pseudo_id
WHERE ft.first_touch_timestamp <= atc.first_add_to_cart_timestamp
  AND atc.first_add_to_cart_timestamp <= p.first_purchase_timestamp
GROUP BY 1, 2
HAVING COUNT(DISTINCT ft.user_pseudo_id) >= 10
ORDER BY avg_days_to_purchase ASC;
The main SELECT statement brings together all three CTEs to perform the analysis of customer journey timing across different traffic sources. The query uses INNER JOIN-s to connect the three datasets, ensuring that only users who have completed the full journey from first touch through add-to-cart to purchase are included in the analysis. This approach provides a cohort-based view of users who have demonstrated the complete conversion behavior pattern.
The SELECT clause calculates several metrics including the count of total users for each traffic source and medium combination, the average number of days between first touch and first add-to-cart action, the average days from first touch to first purchase, and the standard deviation for both timing metrics.
The WHERE clause includes logical constraints to ensure data integrity by verifying that the sequence of events follows the expected chronological order: first touch date must precede or equal the add-to-cart date, which must precede or equal the purchase date.
The HAVING clause filters out traffic source and medium combinations with fewer than 10 users, ensuring statistical significance in the results.
Finally, the ORDER BY clause sorts the results by average days to purchase in ascending order, making it easy to identify which traffic sources lead to the fastest conversion times.

Understanding Standard Deviation in Customer Journey Analysis
What is Standard Deviation?
Standard deviation is a statistical measure that quantifies the amount of variation or dispersion in a dataset. In the context of customer journey analysis, it tells us how much individual customer behavior deviates from the average behavior for each traffic source.
Two Different Standard Deviation Formulas:
- Population Standard Deviation (uses N): σ = √(Σ(xi - μ)² / N)
- Sample Standard Deviation (uses N-1): σ = √(Σ(xi - x̄)² / (N-1))
Where:
- σ = standard deviation
- xi = each individual data point (days to conversion for each customer)
- μ (mu) = mean (average days to conversion)
- N = total number of customers
STDDEV() uses N-1 (sample standard deviation)
STDDEV_POP() uses N (population standard deviation) - available if you specifically need it
The standard deviation calculations using STDDEV() provide important context about the variability in timing within each source-medium combination. High standard deviation indicates that users from that source have widely varying conversion timelines, while low standard deviation suggests more consistent behavior patterns.
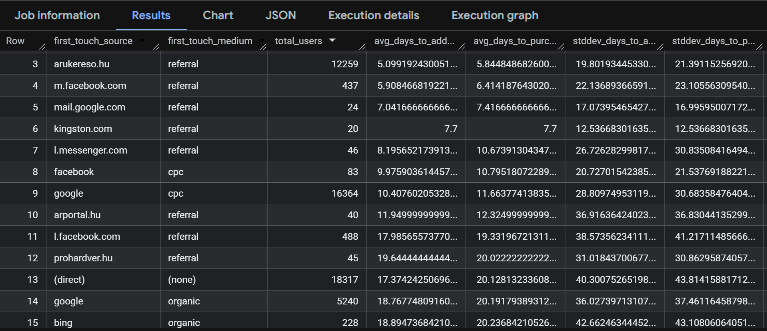
In our analysis, we've observed that the standard deviation is approximately 2-3x the average conversion time across most traffic sources. This is a significant finding that reveals important insights about customer behavior patterns.

A standard deviation that is more than double the average (11.76 vs 5.47, first row) indicates a skewed distribution rather than a normal bell curve. This means your customers don't actually behave "on average" - instead, they fall into distinct behavioral segments.
The wide range of behaviors suggests that different customer groups follow distinct paths and timelines, requiring specific engagement and marketing strategies. Additionally, budget planning becomes more complex, as some campaigns may deliver returns much later than others, making it difficult to assess performance using short-term metrics alone. Finally, retargeting strategies must be diversified, while some users respond best to immediate follow-ups, others require long-term engagement and sustained communication before converting.
Bonus: Alternative Approach Using the user_first_touch_timestamp Field
WITH first_touch_users AS (
  SELECT
    user_pseudo_id,
    DATE(TIMESTAMP_MICROS(user_first_touch_timestamp)) as first_touch_date,
    traffic_source.source as first_touch_source,
    traffic_source.medium as first_touch_medium
  FROM `bigquery-public-data.ga4_obfuscated_sample_ecommerce.events_*`
  WHERE user_first_touch_timestamp IS NOT NULL
    AND traffic_source.source IS NOT NULL
    AND traffic_source.medium IS NOT NULL
  GROUP BY 1, 2, 3, 4
)
For organizations with complete historical GA4 data looking to measure the true timing of the customer lifetime journey, the user_first_touch_timestamp approach is a reliable method. This column captures the exact moment GA4 first identified each user, independent of the current dataset's date range limitations.
In this example, however, we are working with a limited public GA4 dataset that contains only a few months of data. As a result, the analysis is focused on alternative logic suited to the available data. Nonetheless, I encourage you to experiment with the user_first_touch_timestamp column in your own GA4 property, especially if you have access to the full historical dataset, it can provide more accurate insights into user acquisition and long-term behavior.
Now it's your turn!
I hope you've enjoyed this tutorial and feel a bit more confident to utilise your own Google Analytics data in BigQuery. Drop a line in the comments if you have any questions, feedback or suggestions related to this article.
