How to set up Google 'Connected' Sheets to access GA4 BigQuery export data without learning SQL
In this tutorial we will show how to set up the Connected Sheets feature in Google Sheets, so end users can interact with GA4 export data in BigQuery without the need to understand SQL.
For the average spreadsheet user, cutting off a leg might seem more appealing than plunging into the depths of Google Cloud. Enter Connected Sheets, a feature that enables you (and your colleagues) to interact with the GA4 export data in BigQuery, directly within Google Sheets.
Connected Sheets enables you to navigate large datasets (potentially millions or billions of rows), perform calculations using familiar spreadsheet functions, set up pivot tables, and visualize data through charts, all without the need for SQL expertise for the end user*.
In this tutorial we will show how to set up the Connected Sheets feature in Google Sheets, so end users can interact with GA4 export data in BigQuery without the need to understand SQL.
Exploration: create your first connection
Open a new Google Sheet. My favorite way of doing this is by typing sheets.new in the browser's url bar. Provide a name for the spreadsheet.
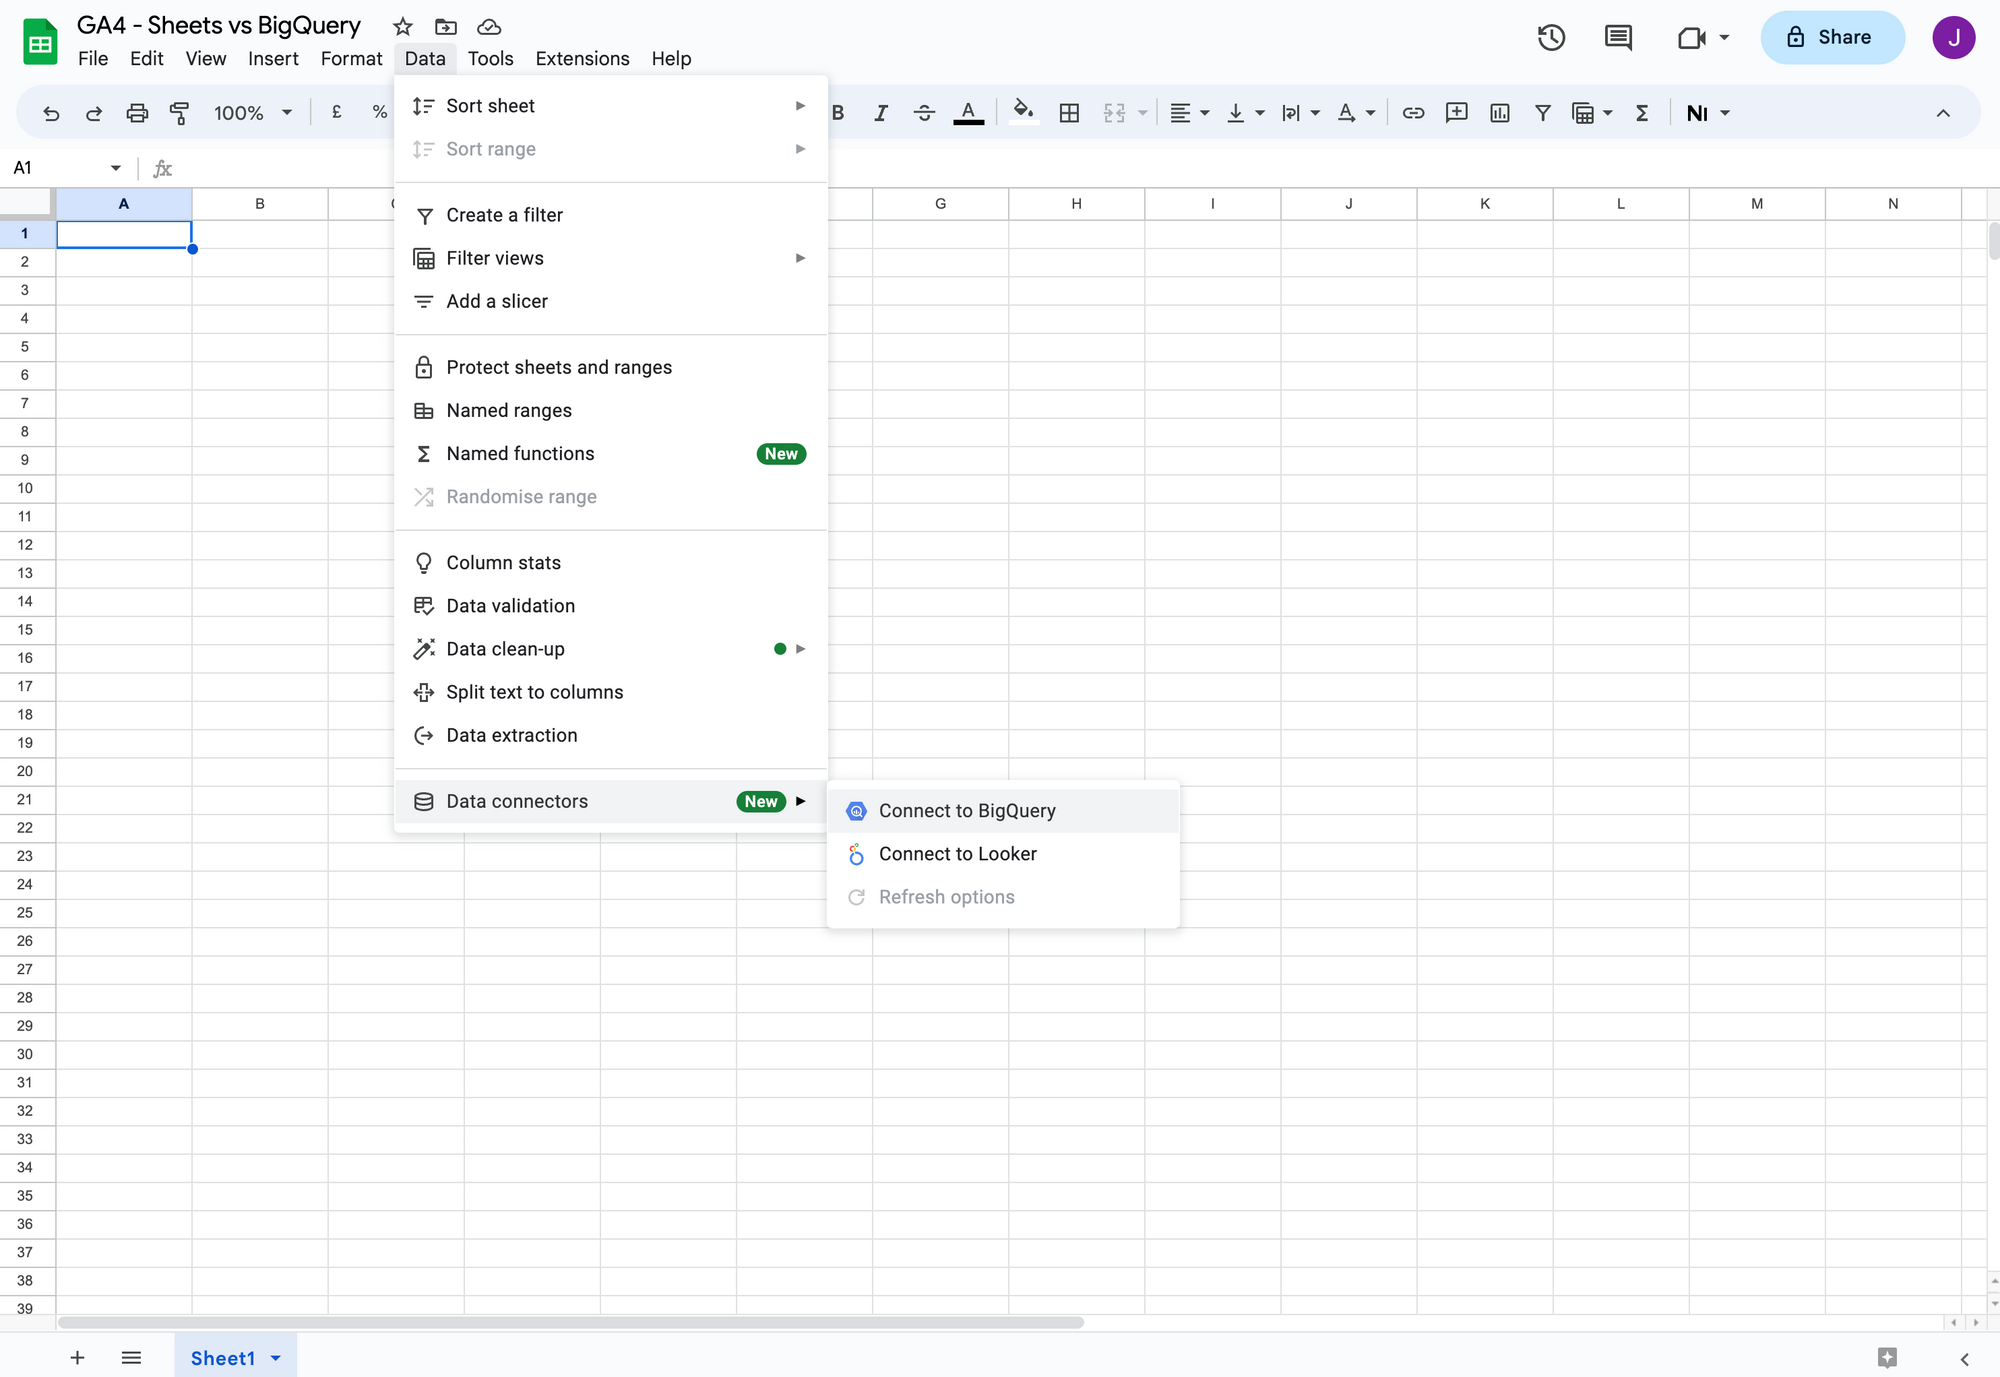
Then click Data, Data connectors and Connect to BigQuery.
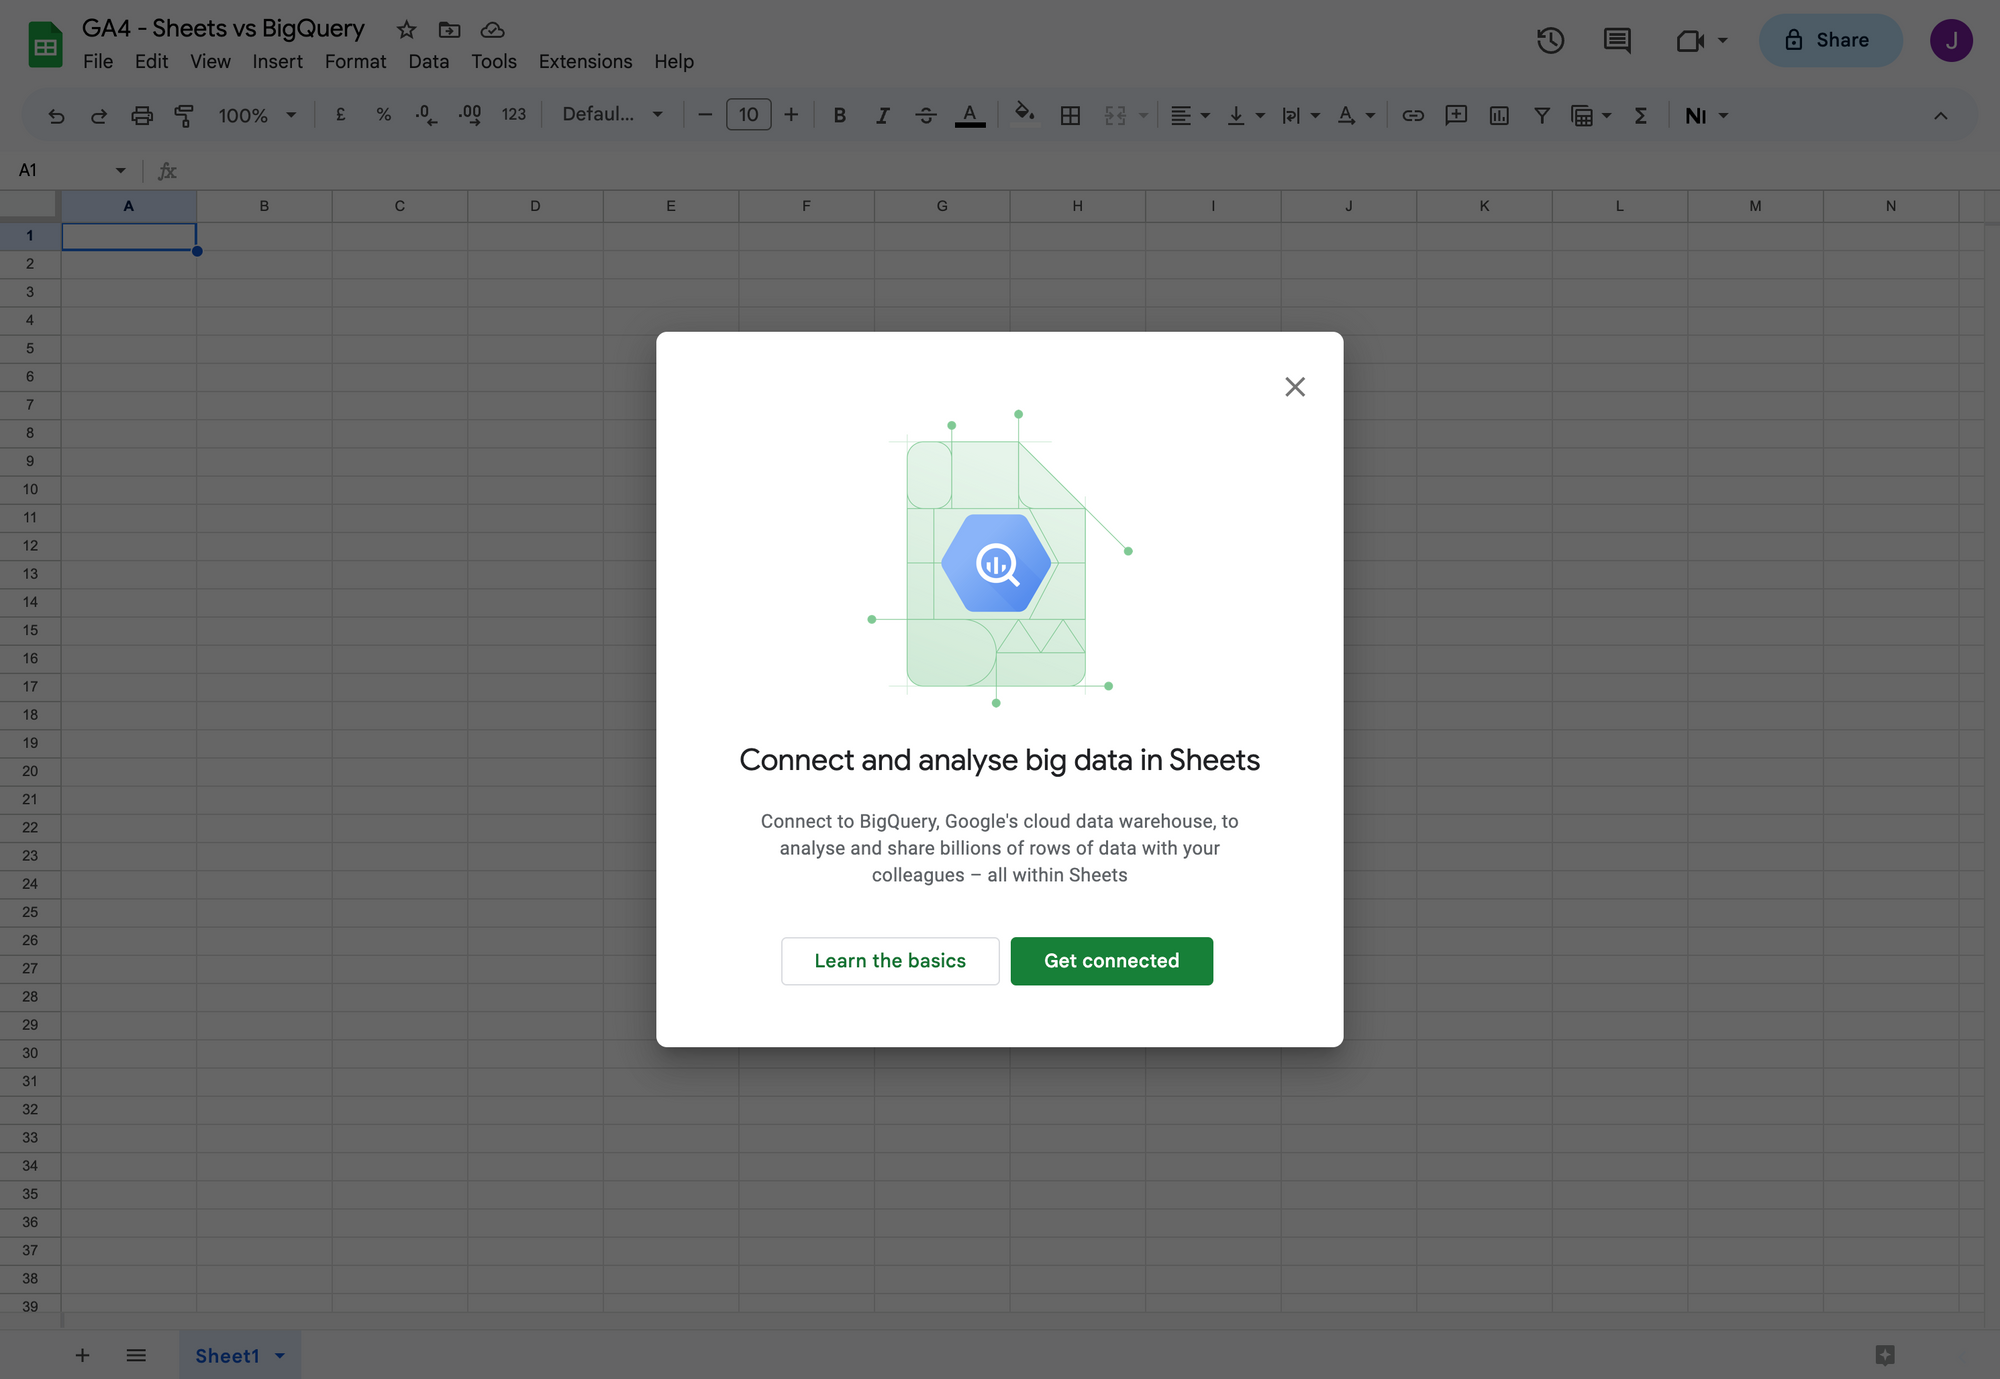
Click Get connected and pick a billing project and the data set for your GA4 export data (starting with analytics_).
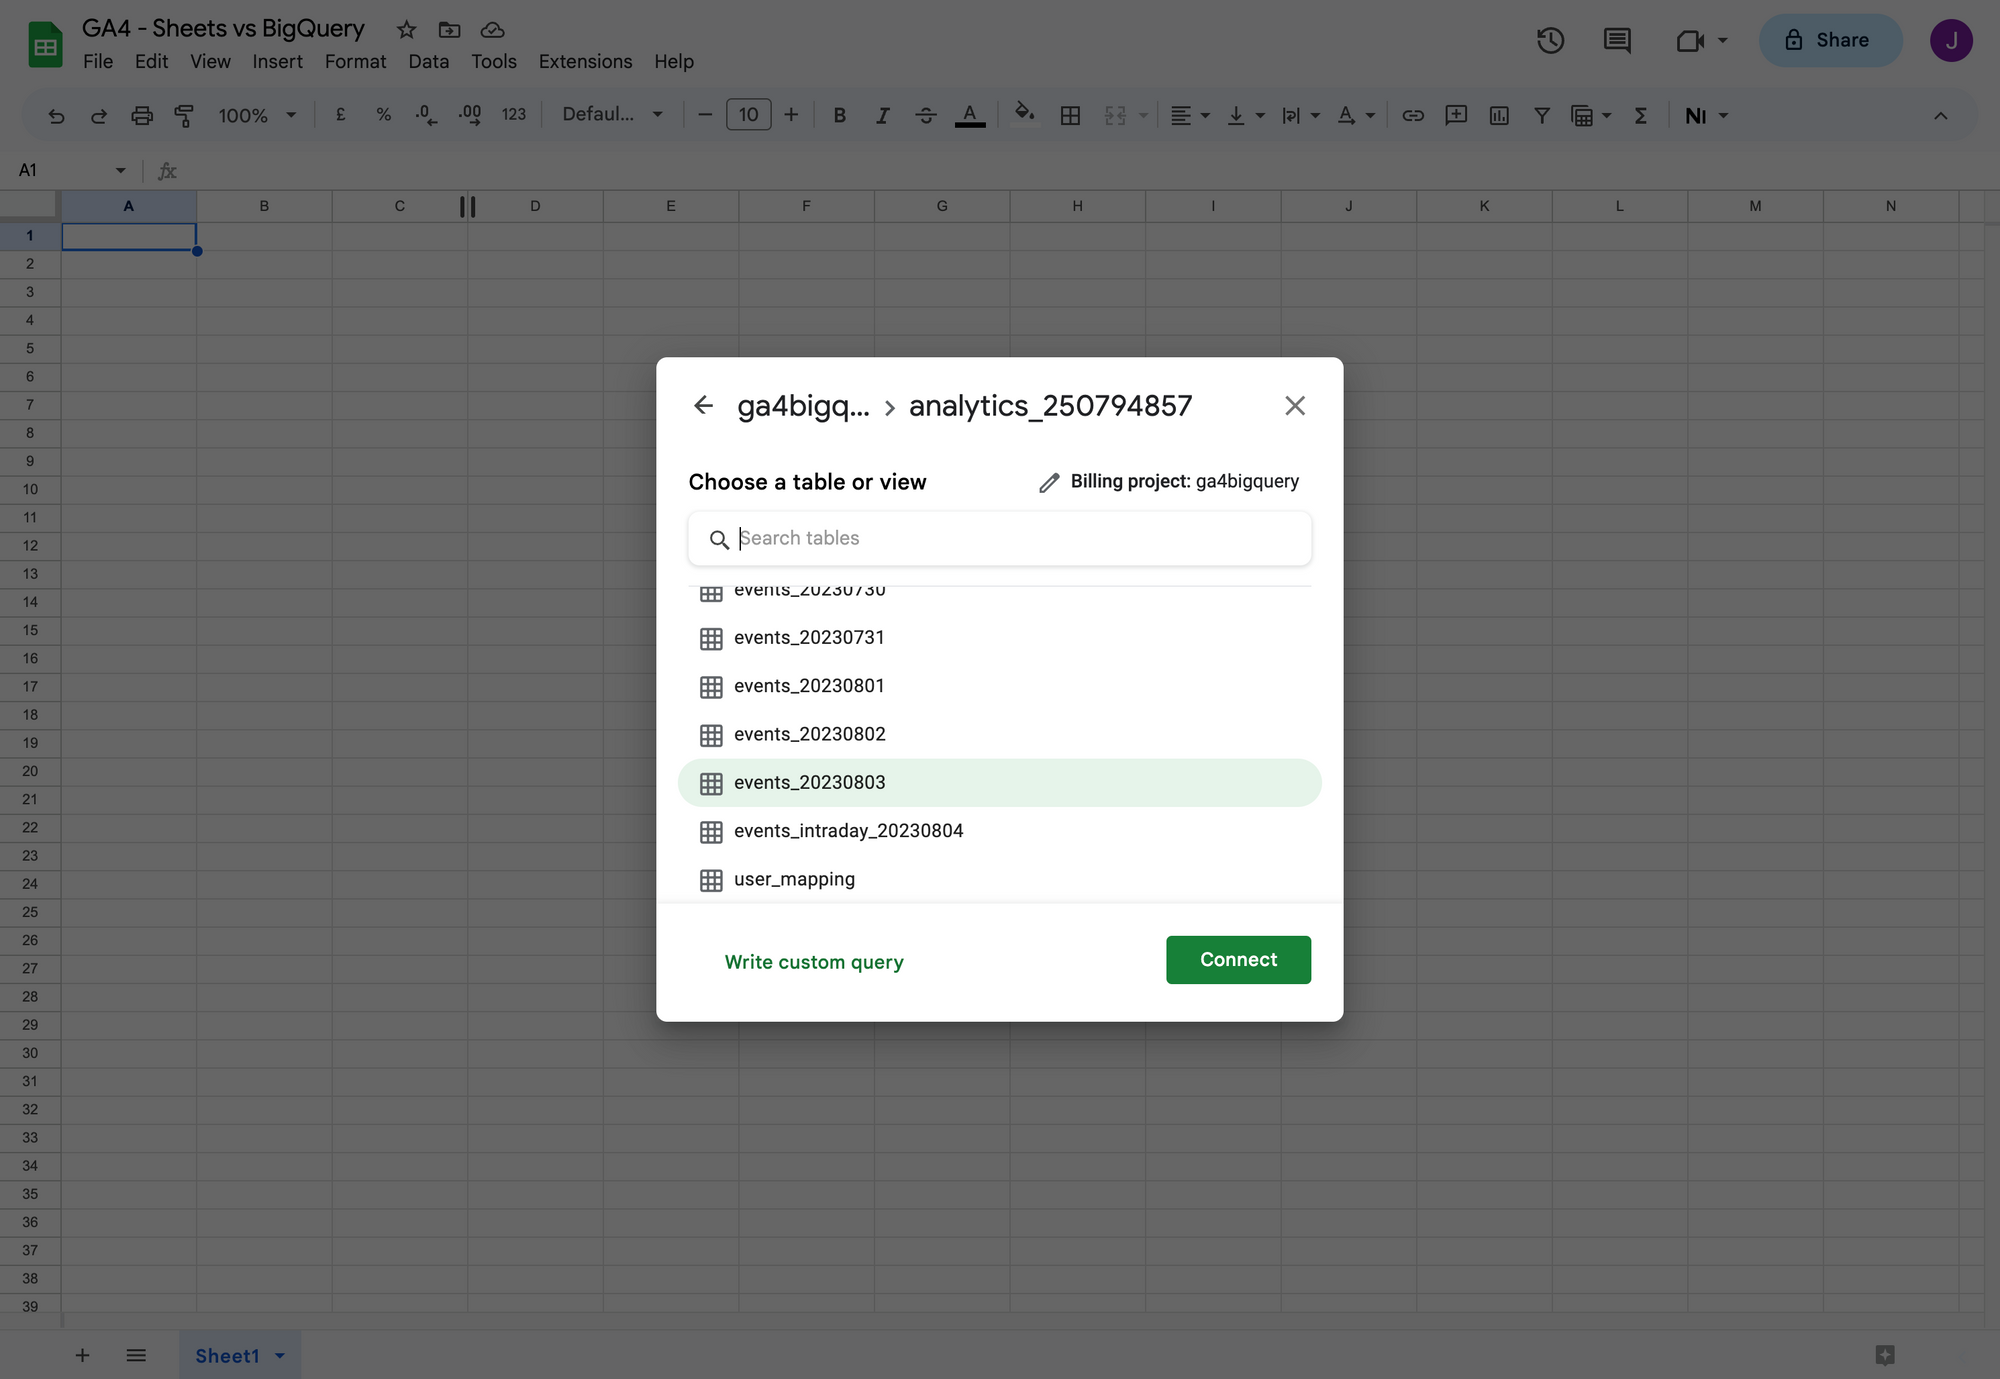
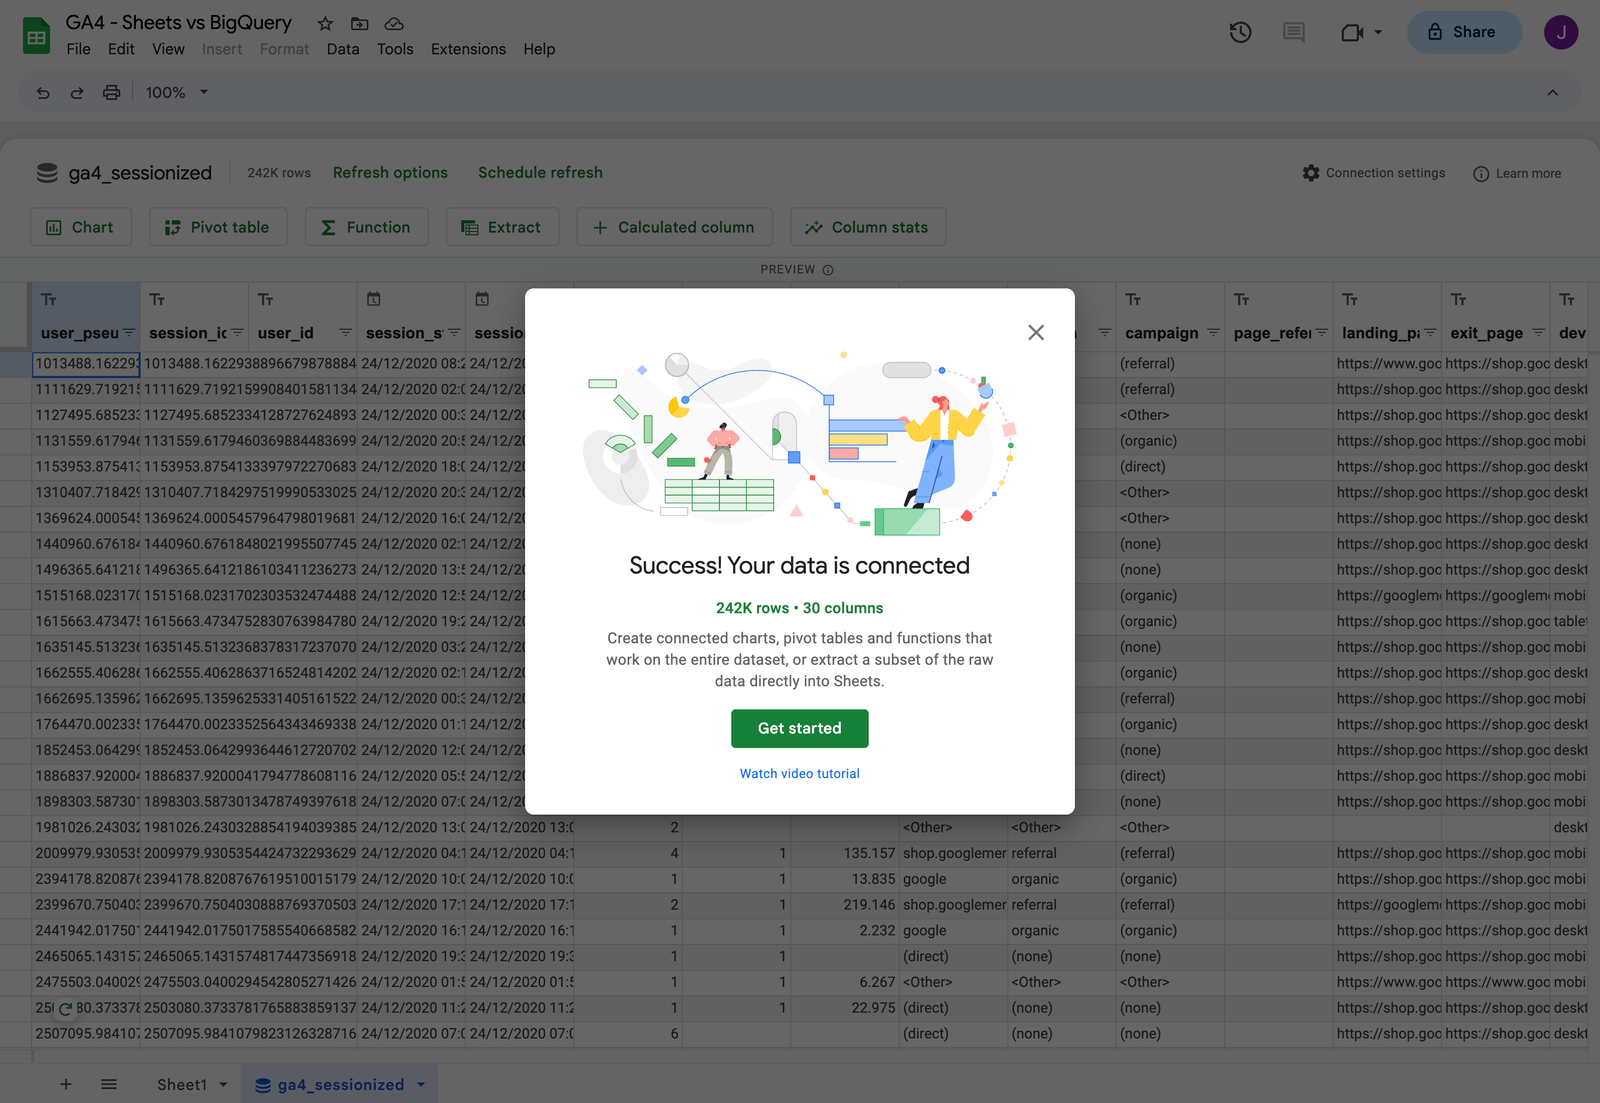
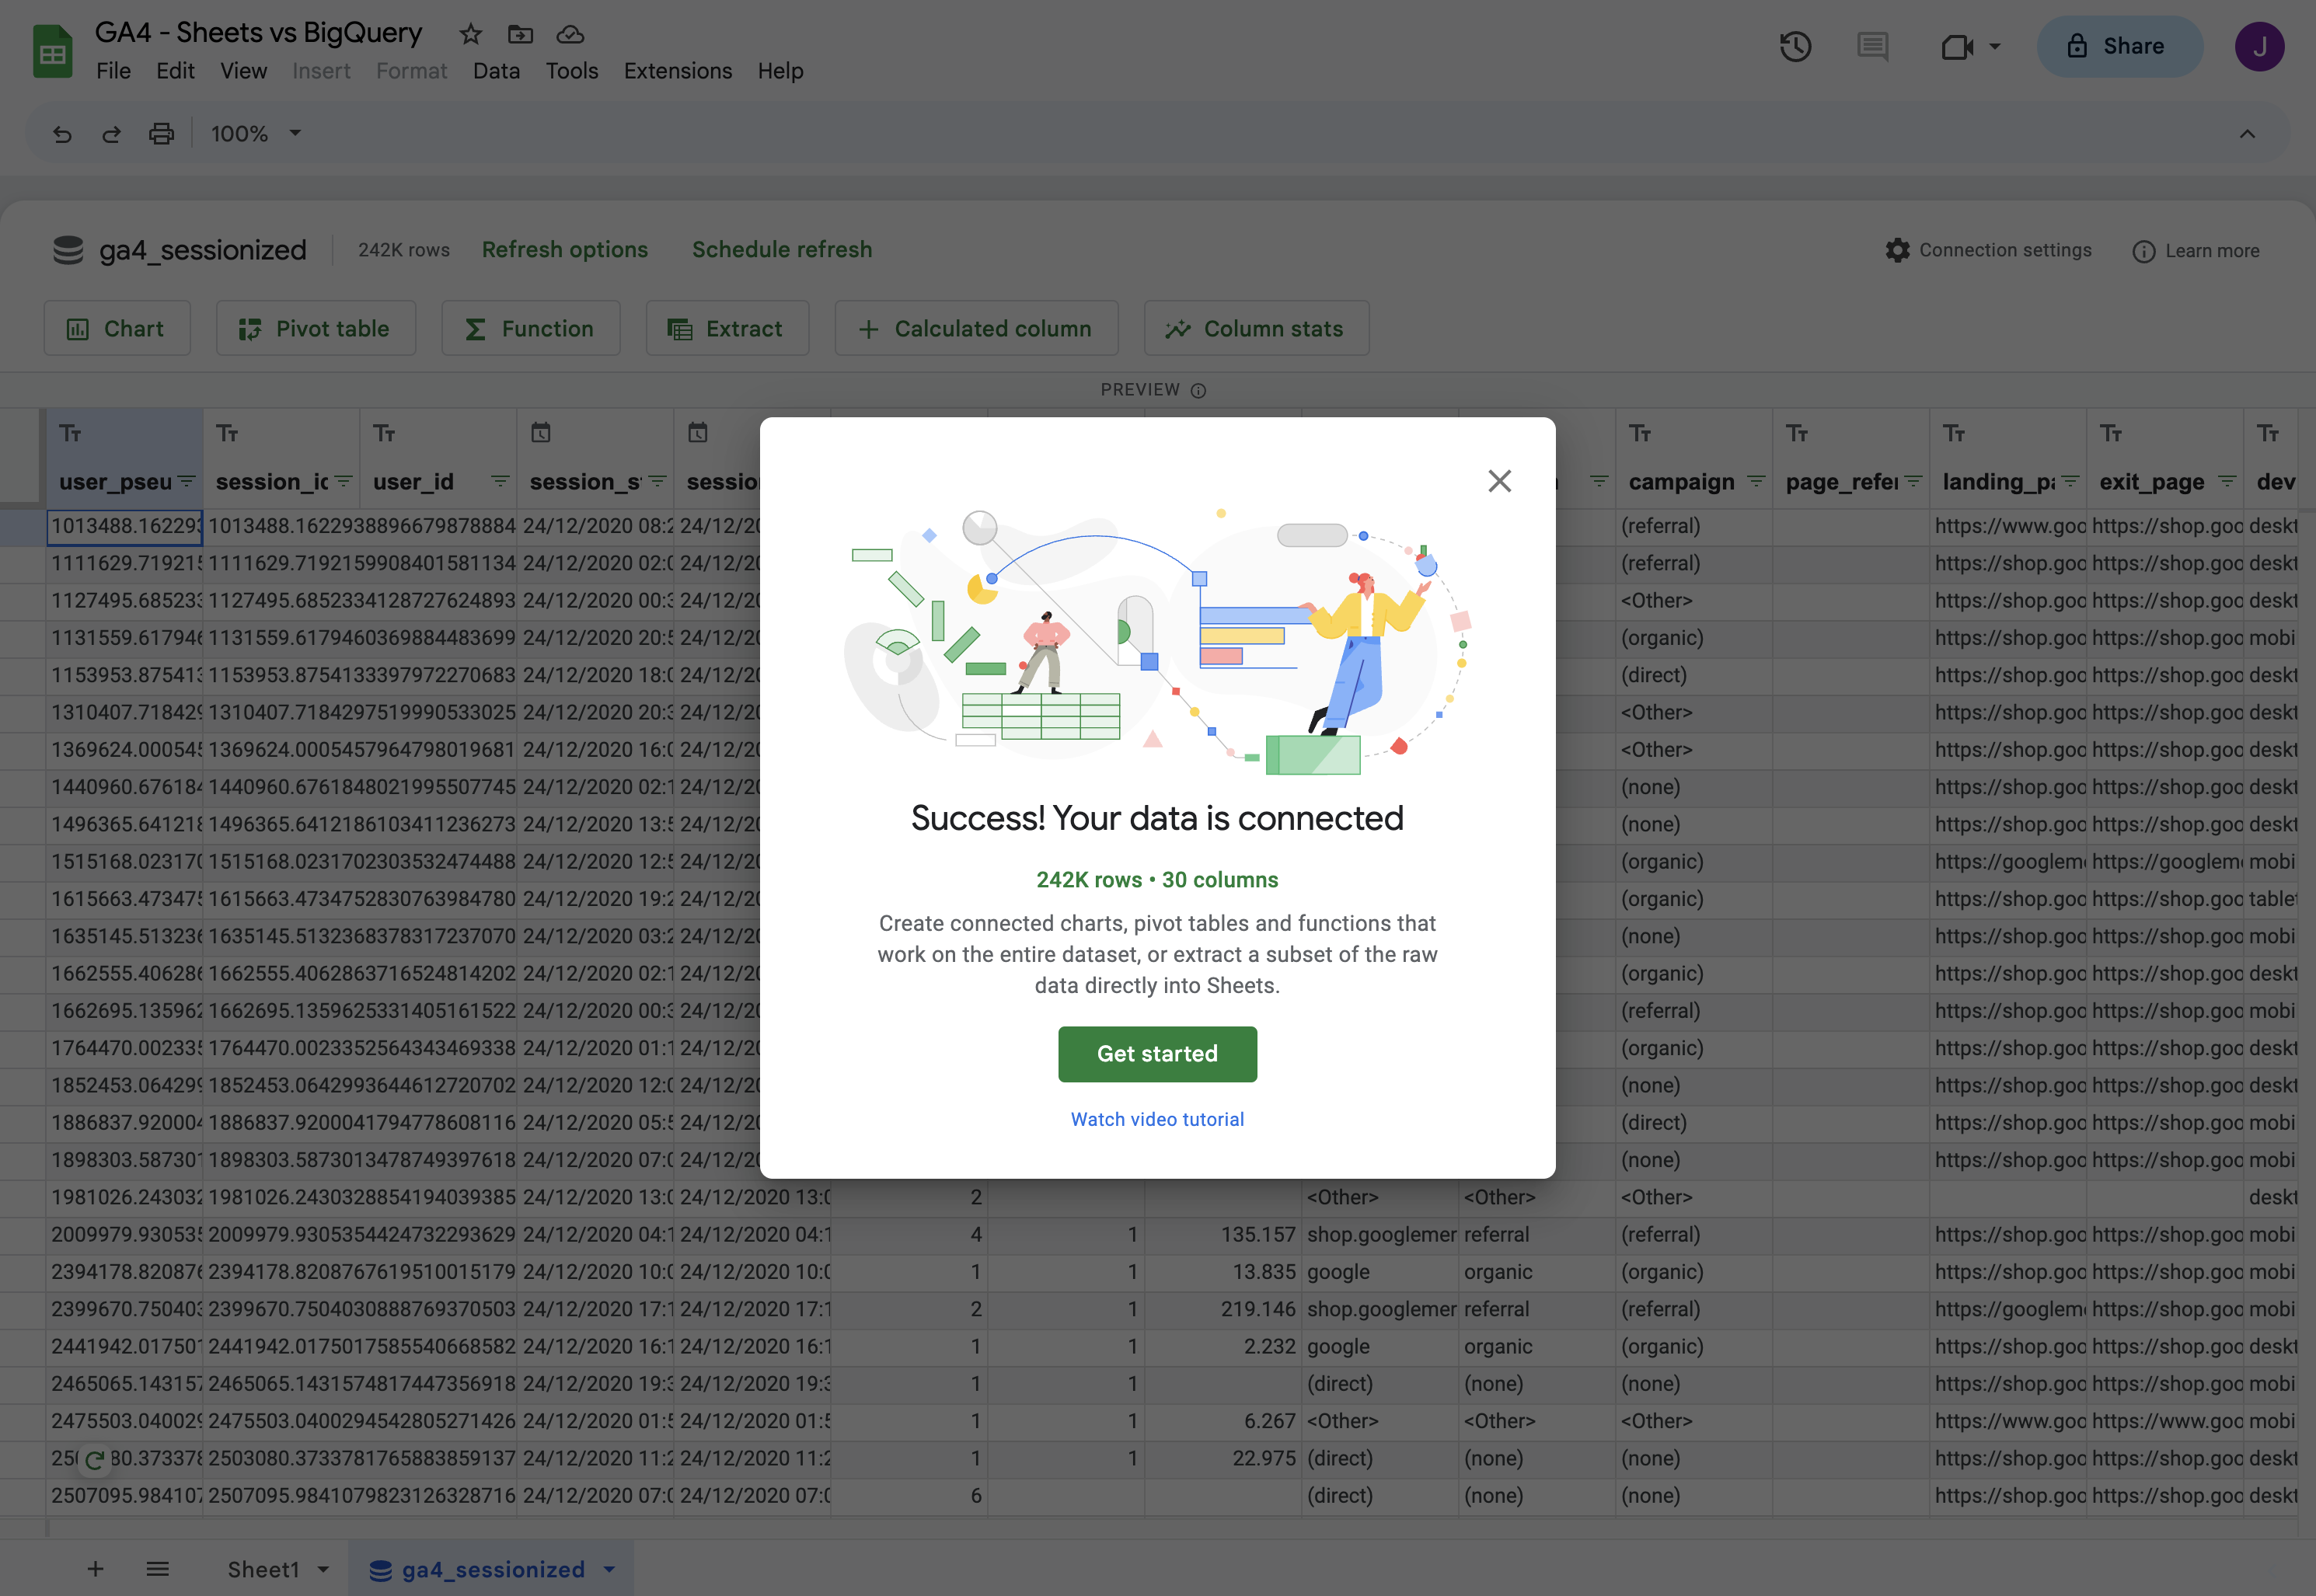
Select a recent table (you might have to scroll down to the bottom of the list). Click Connect and you should see a success message.
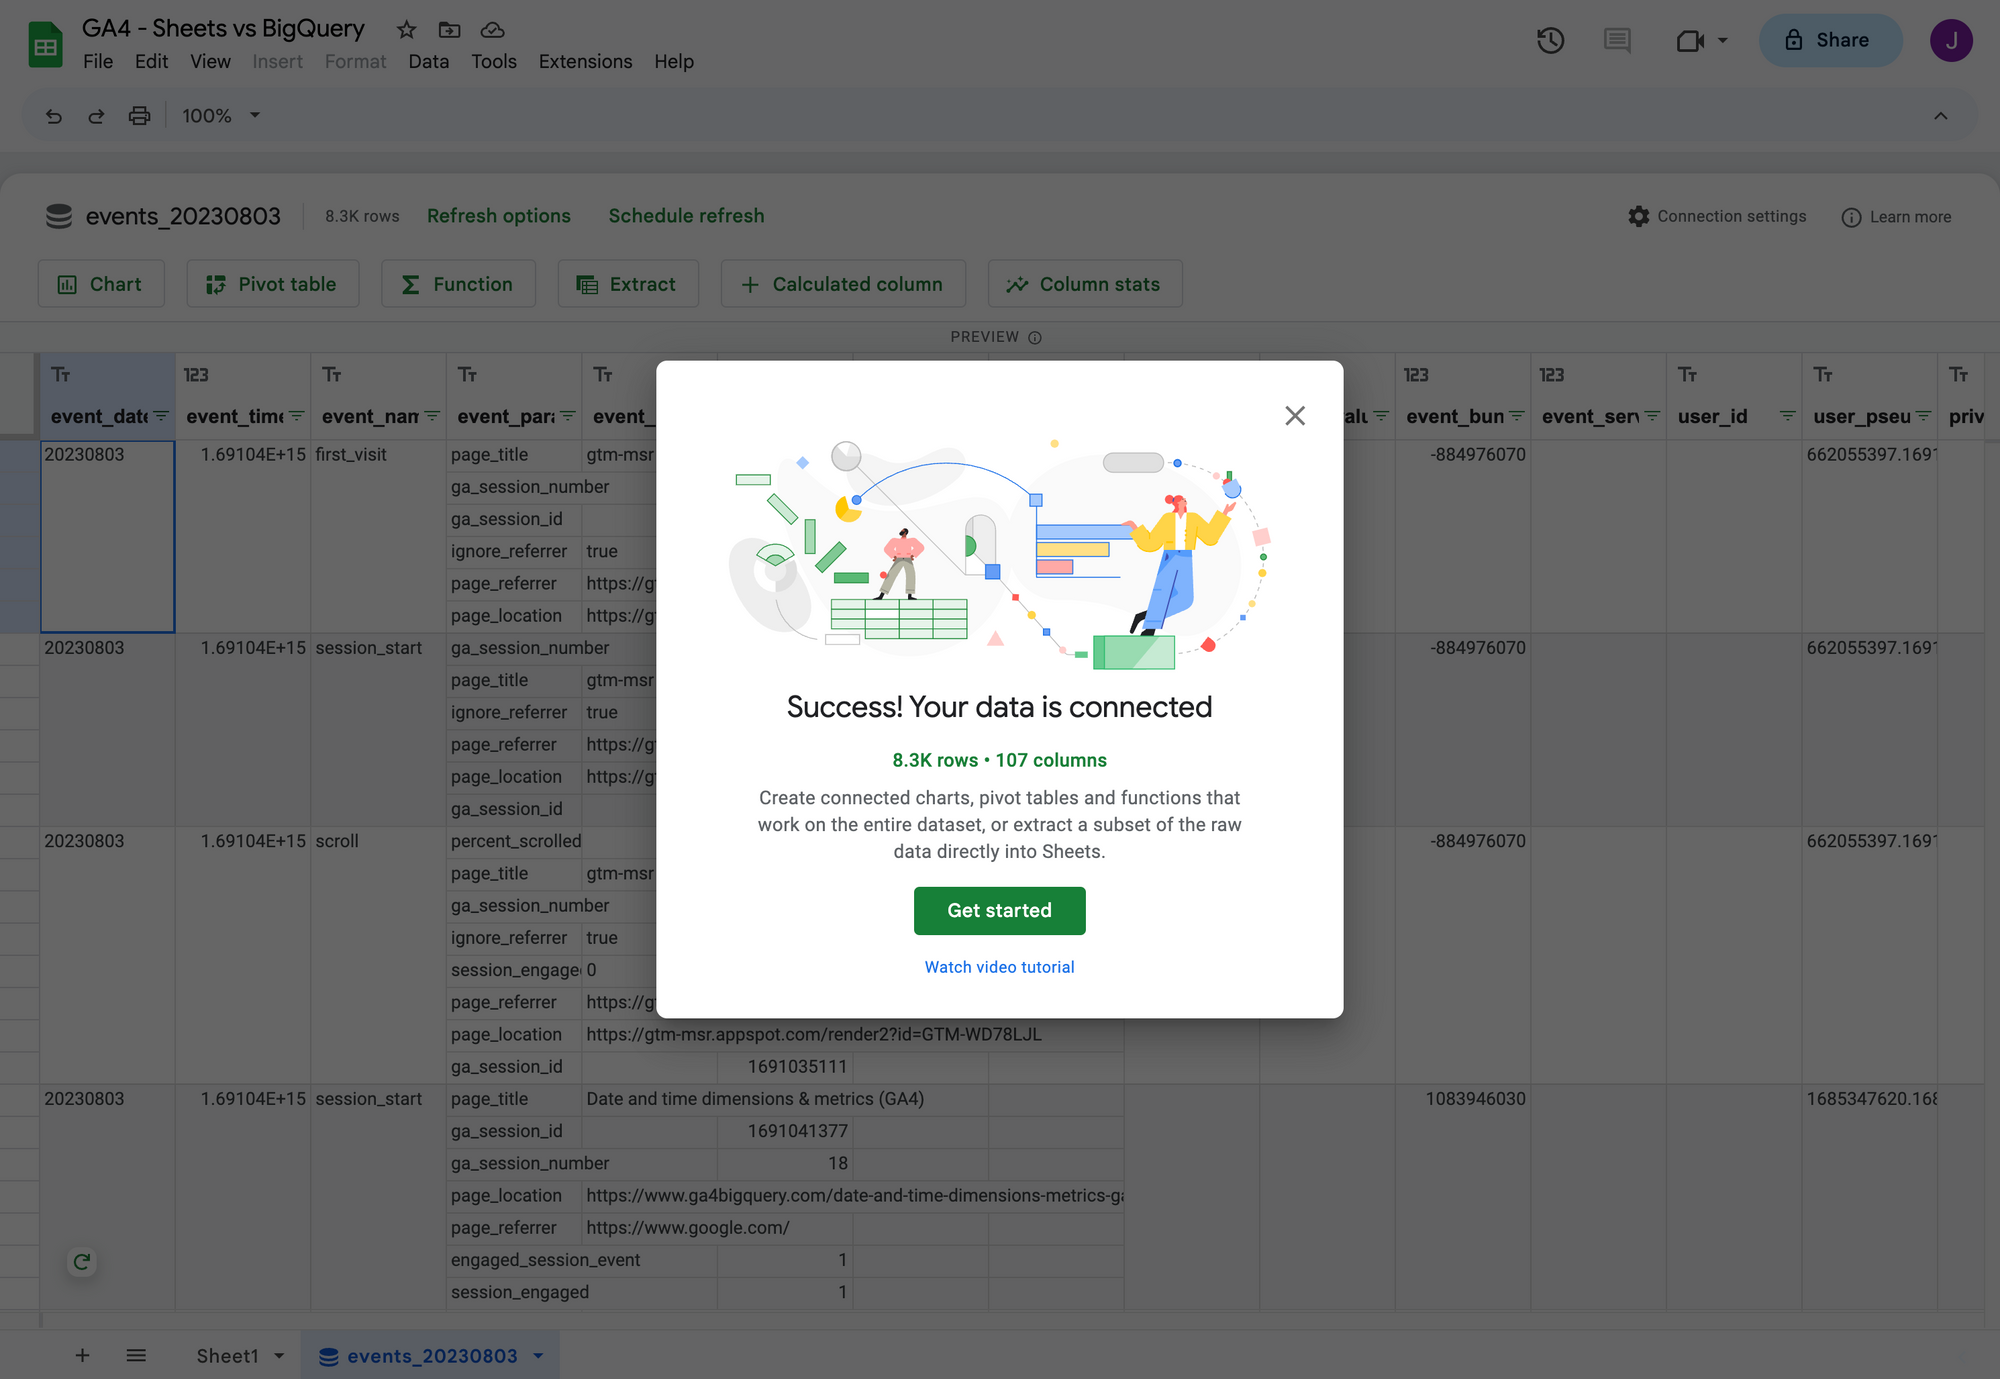
Click Get started. What you are seeing now is a preview of GA4 events schema. Obviously, these results don't make sense in a spreadsheet environment. Not only because the raw event data is stored in nested and repeated fields (e.g. event parameters), but every interaction in Sheets would also trigger a query against the raw event data, which can be very costly if you have a lot of traffic on your website.
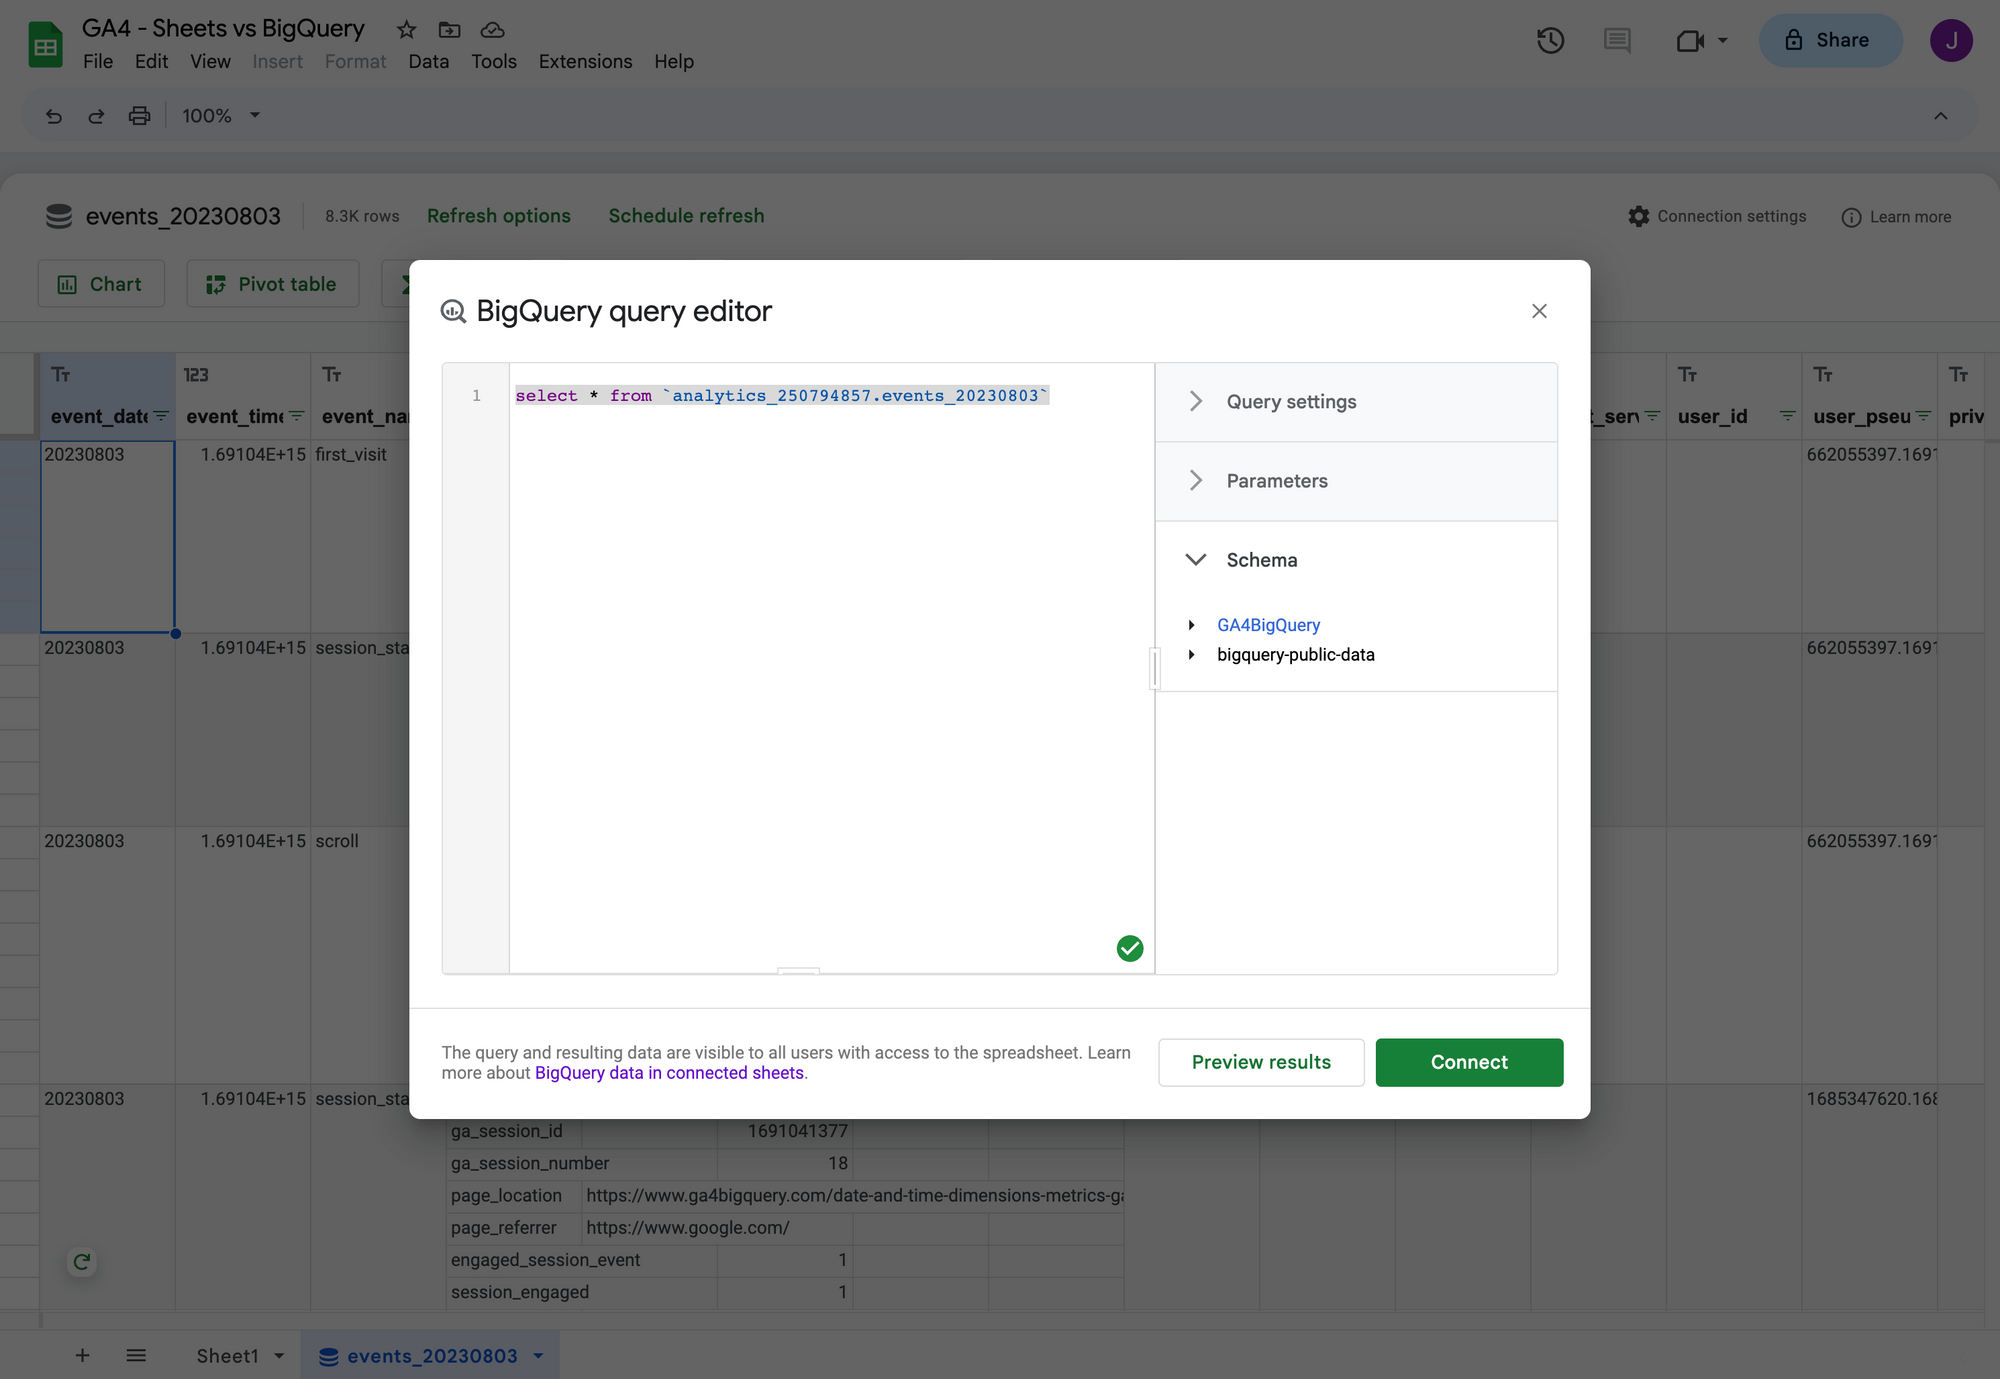
You can see this by clicking on Connection settings and then Edit (next to Review project selection). You will see the connection options again, where you can select Write custom query. This reveals what happens behind the scenes: it was just a select * request to the selected schema in BigQuery.
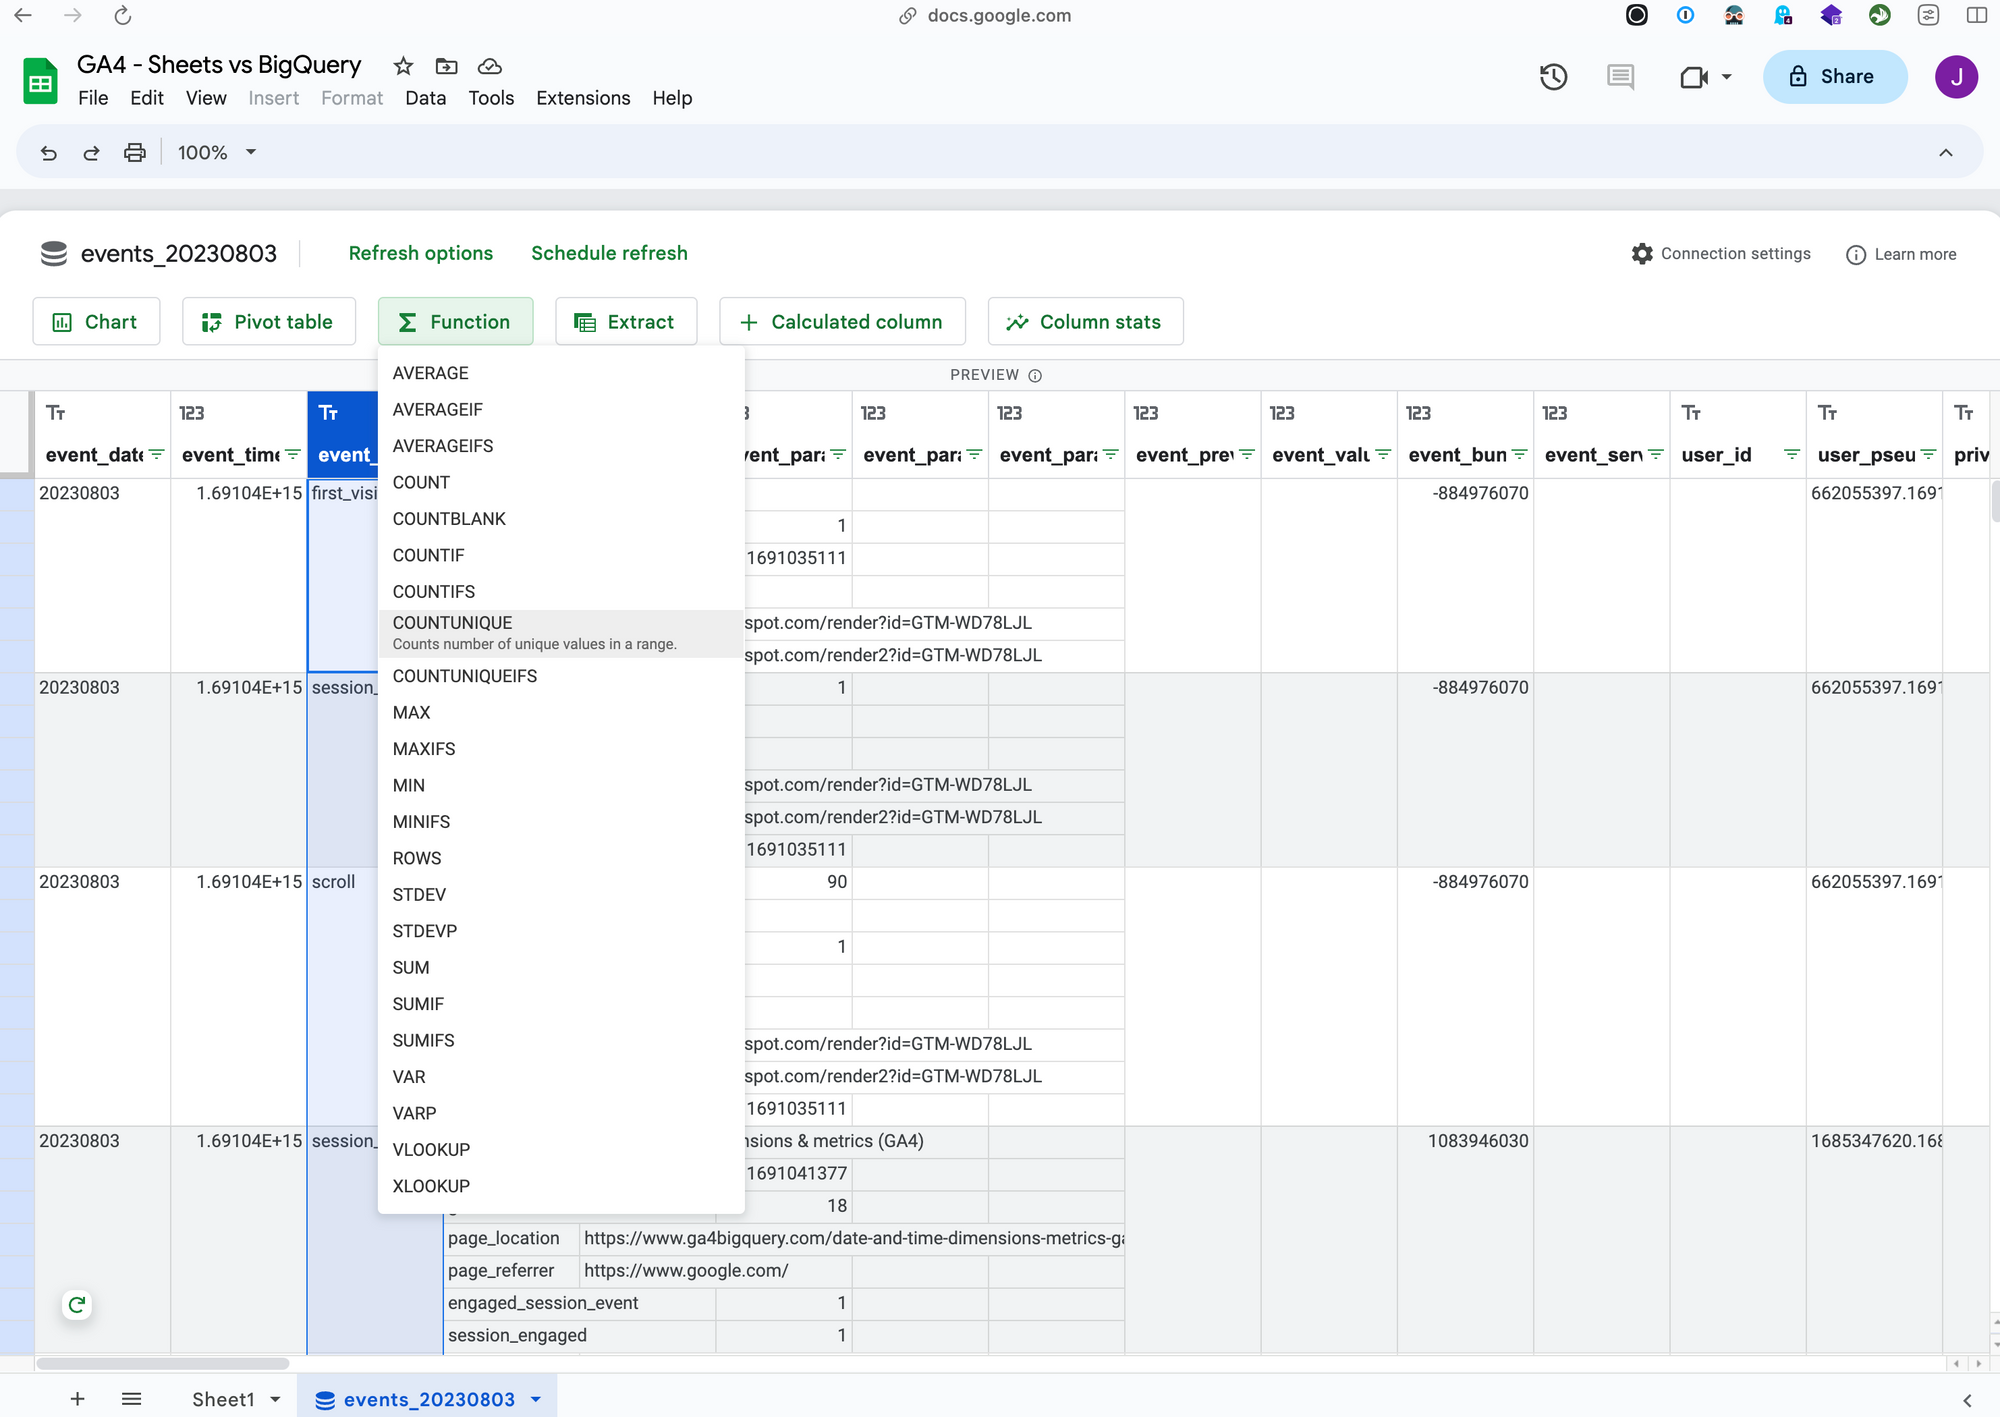
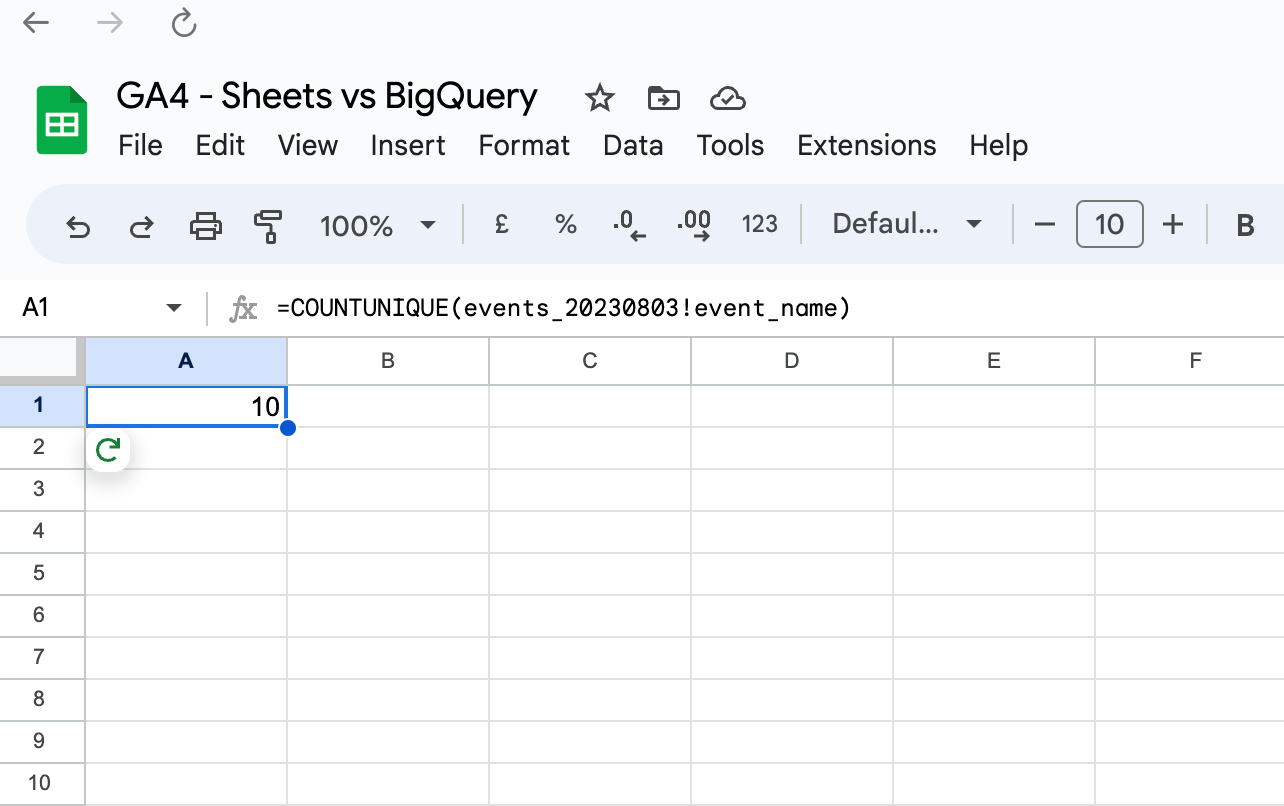
If we go back and perform a calculation based on the preview, like a countunique() on the event_name column, we will get the result in cell A1.
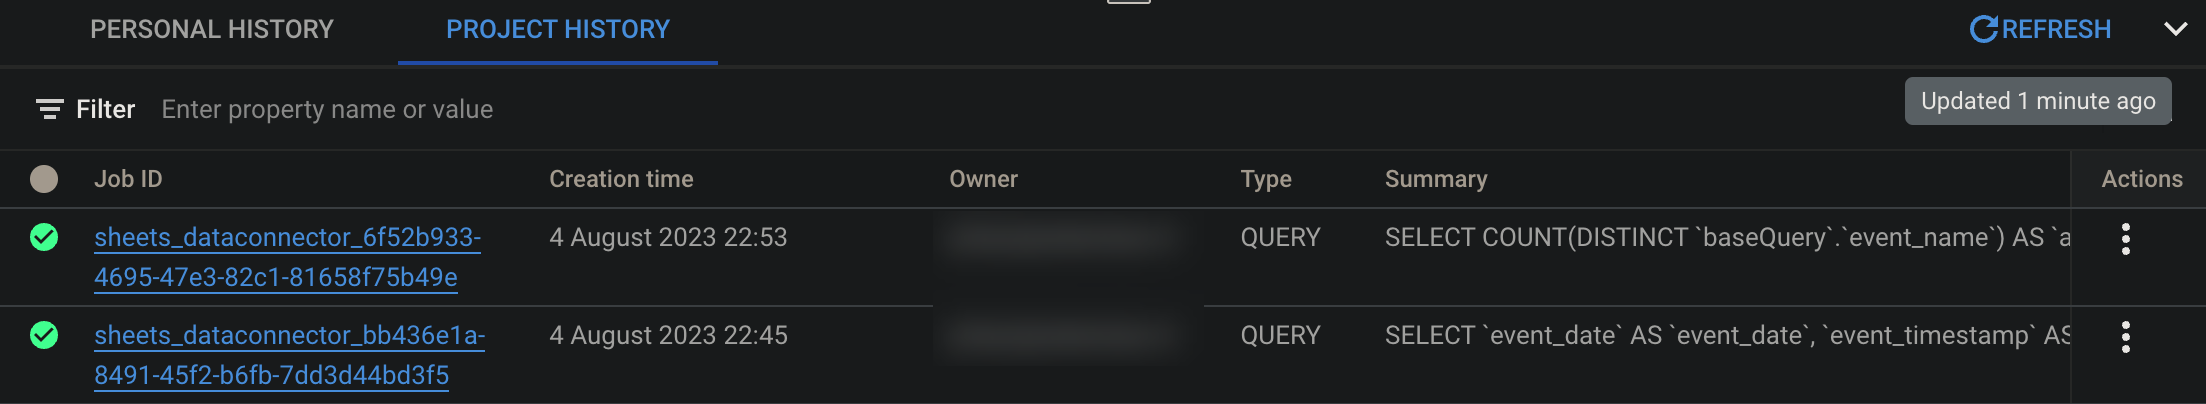
Let's switch to the BigQuery editor to see what happened there. Select Project history in the bottom bar. You'll see some activity initiated by the sheets_dataconnector. This is the confirmation that every change in our spreadsheet triggers a (potentially costly) new query in BigQuery.
If this is not the way to go, what strategies could we use to prepare tables in BigQuery that can be used for self service in Google Sheets?
Preparation strategies
The preferred way of working would be to connect Google Sheets to a table in BigQuery that is already prepared and optimized for this particular use case, so there is no SQL knowledge needed for the end user.
The most important requirement is to 'flatten' the GA4 export event data, so it will no longer contain nested and repeated fields. This can be done in multiple ways (depending on the use case):
- flatten all data and store it in multiple tables using the approach described in this tutorial
- create an aggregated table with data on event, session, user, transaction or product level
- create a ready to go GA4 report
To refresh the data on a set interval, you can make use of scheduled queries in BigQuery, so the tables that are to be consumed by Google Sheets are always up to date.
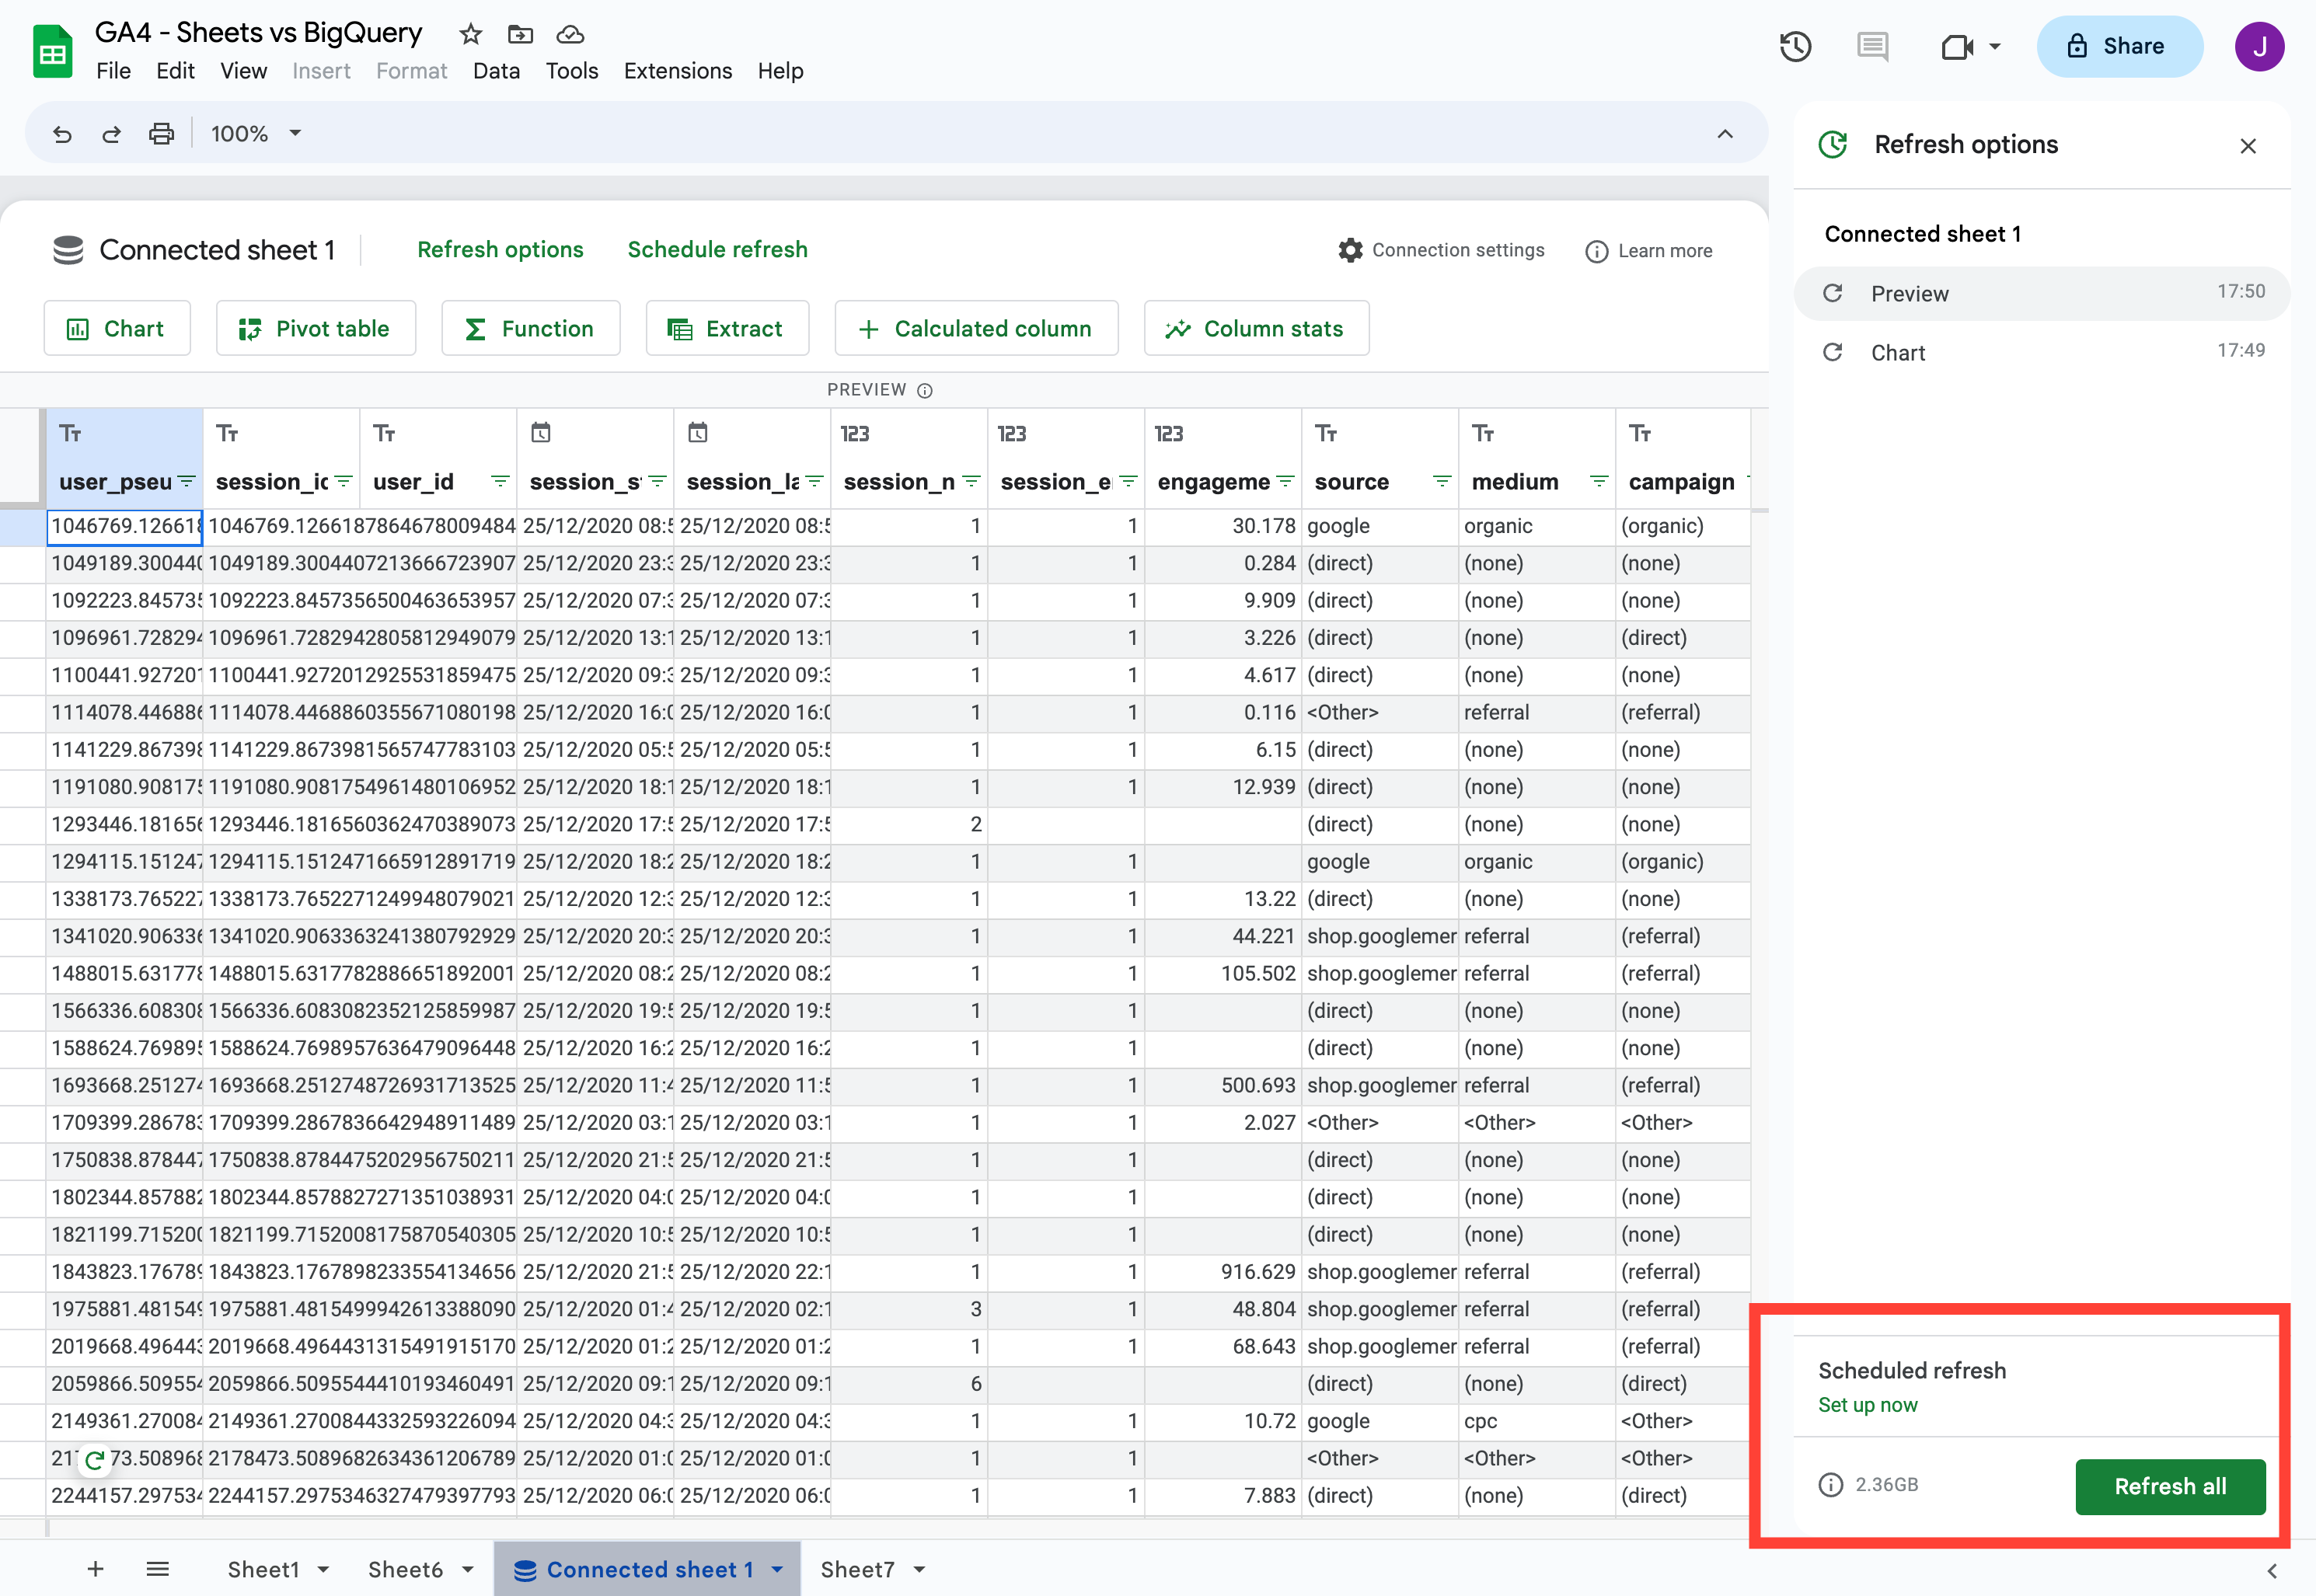
As an example I prepared a sessionized table in BigQuery and created a new connection.
This data set contains 242k rows and 30 columns, but in reality Google Sheets only previews 500 rows (and 30 columns). It is possible to create an extract, so Sheets will pull in up to 50k rows, but in most cases this will only decrease the performance of your Sheet when applying functions.
Click Refresh options to see the amount of data that was processed (in total) in BigQuery, per interaction you had with the data. If you click on one of the interactions, it will refresh the query and you will see the individual amount of data needed to perform the action.
In this example our strategy definitely works, as the amount of data that was processed to perform the action (8MB) is very modest, compared to the amount that would be needed when querying the raw data.
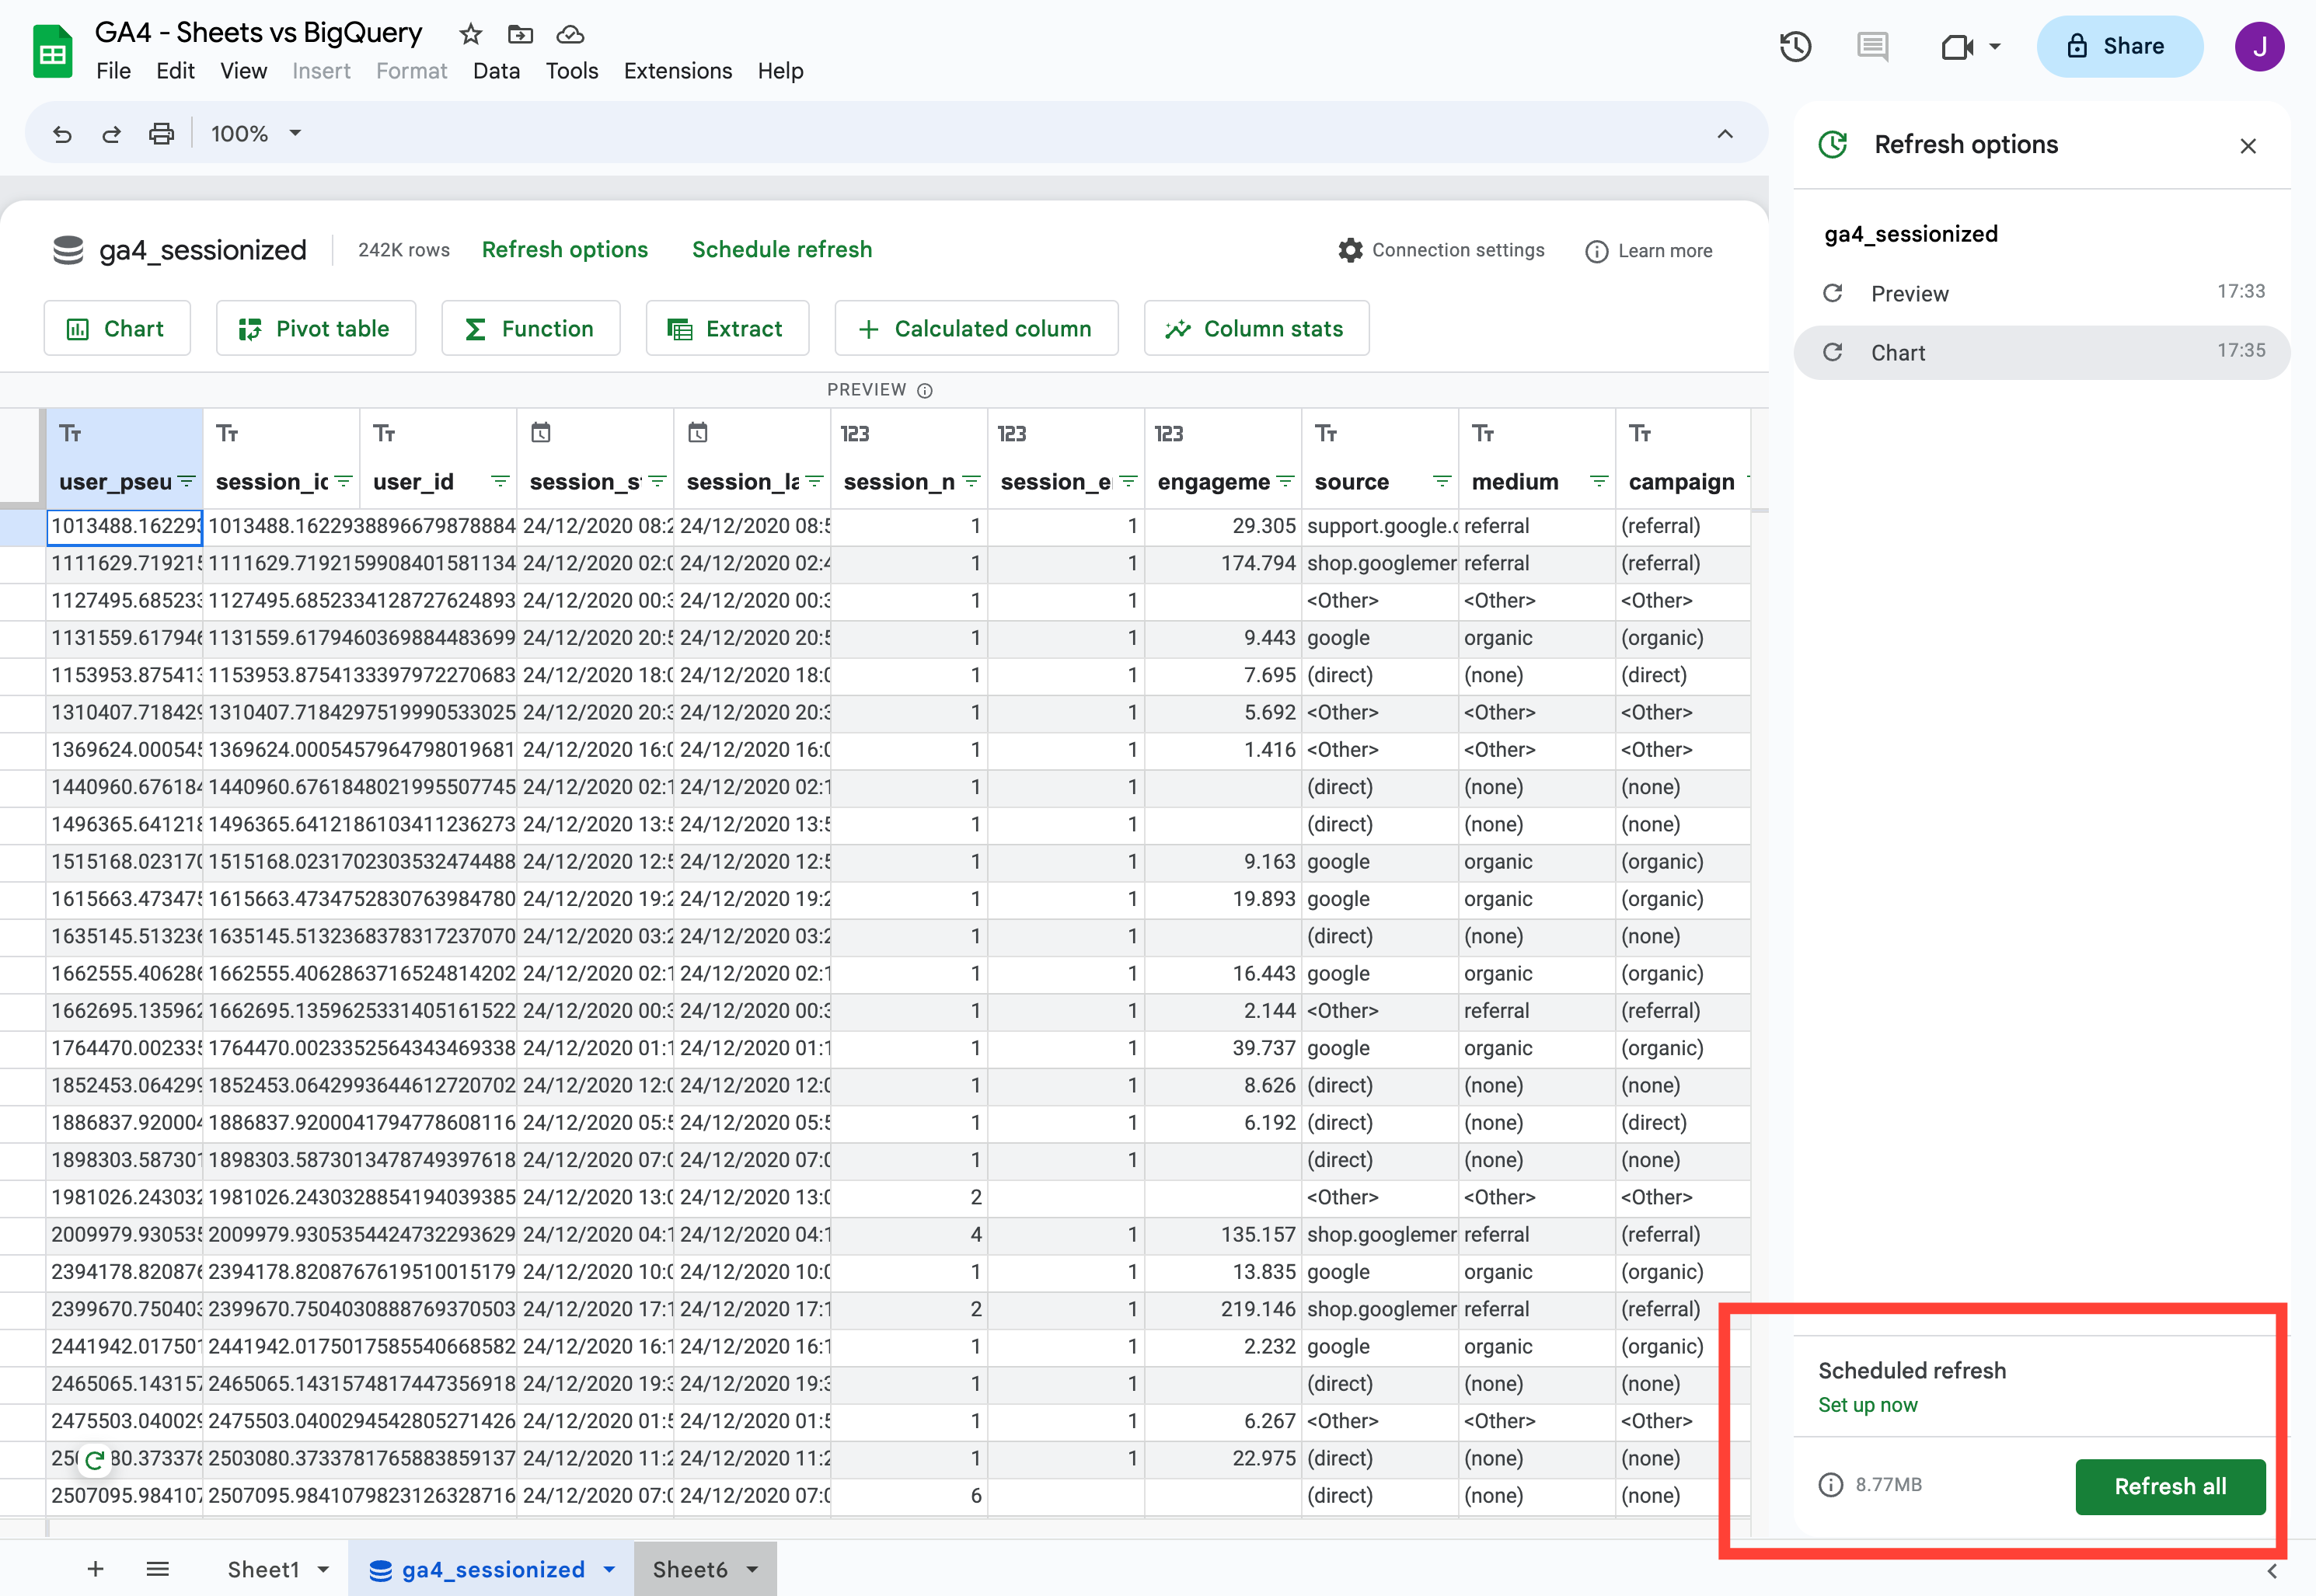
If the data should be updated automatically, especially important when charts need to reflect the latest data, you can set up a scheduled refresh.
Set up a custom query
If - for some reason - preparing a flat table in BigQuery is not an option, then you can also use the custom query function in Connected Sheets to set up a connection.
But beware, you should only do this for a use case where you just need to pull in some data once or twice and don't need to wrangle the data too much.
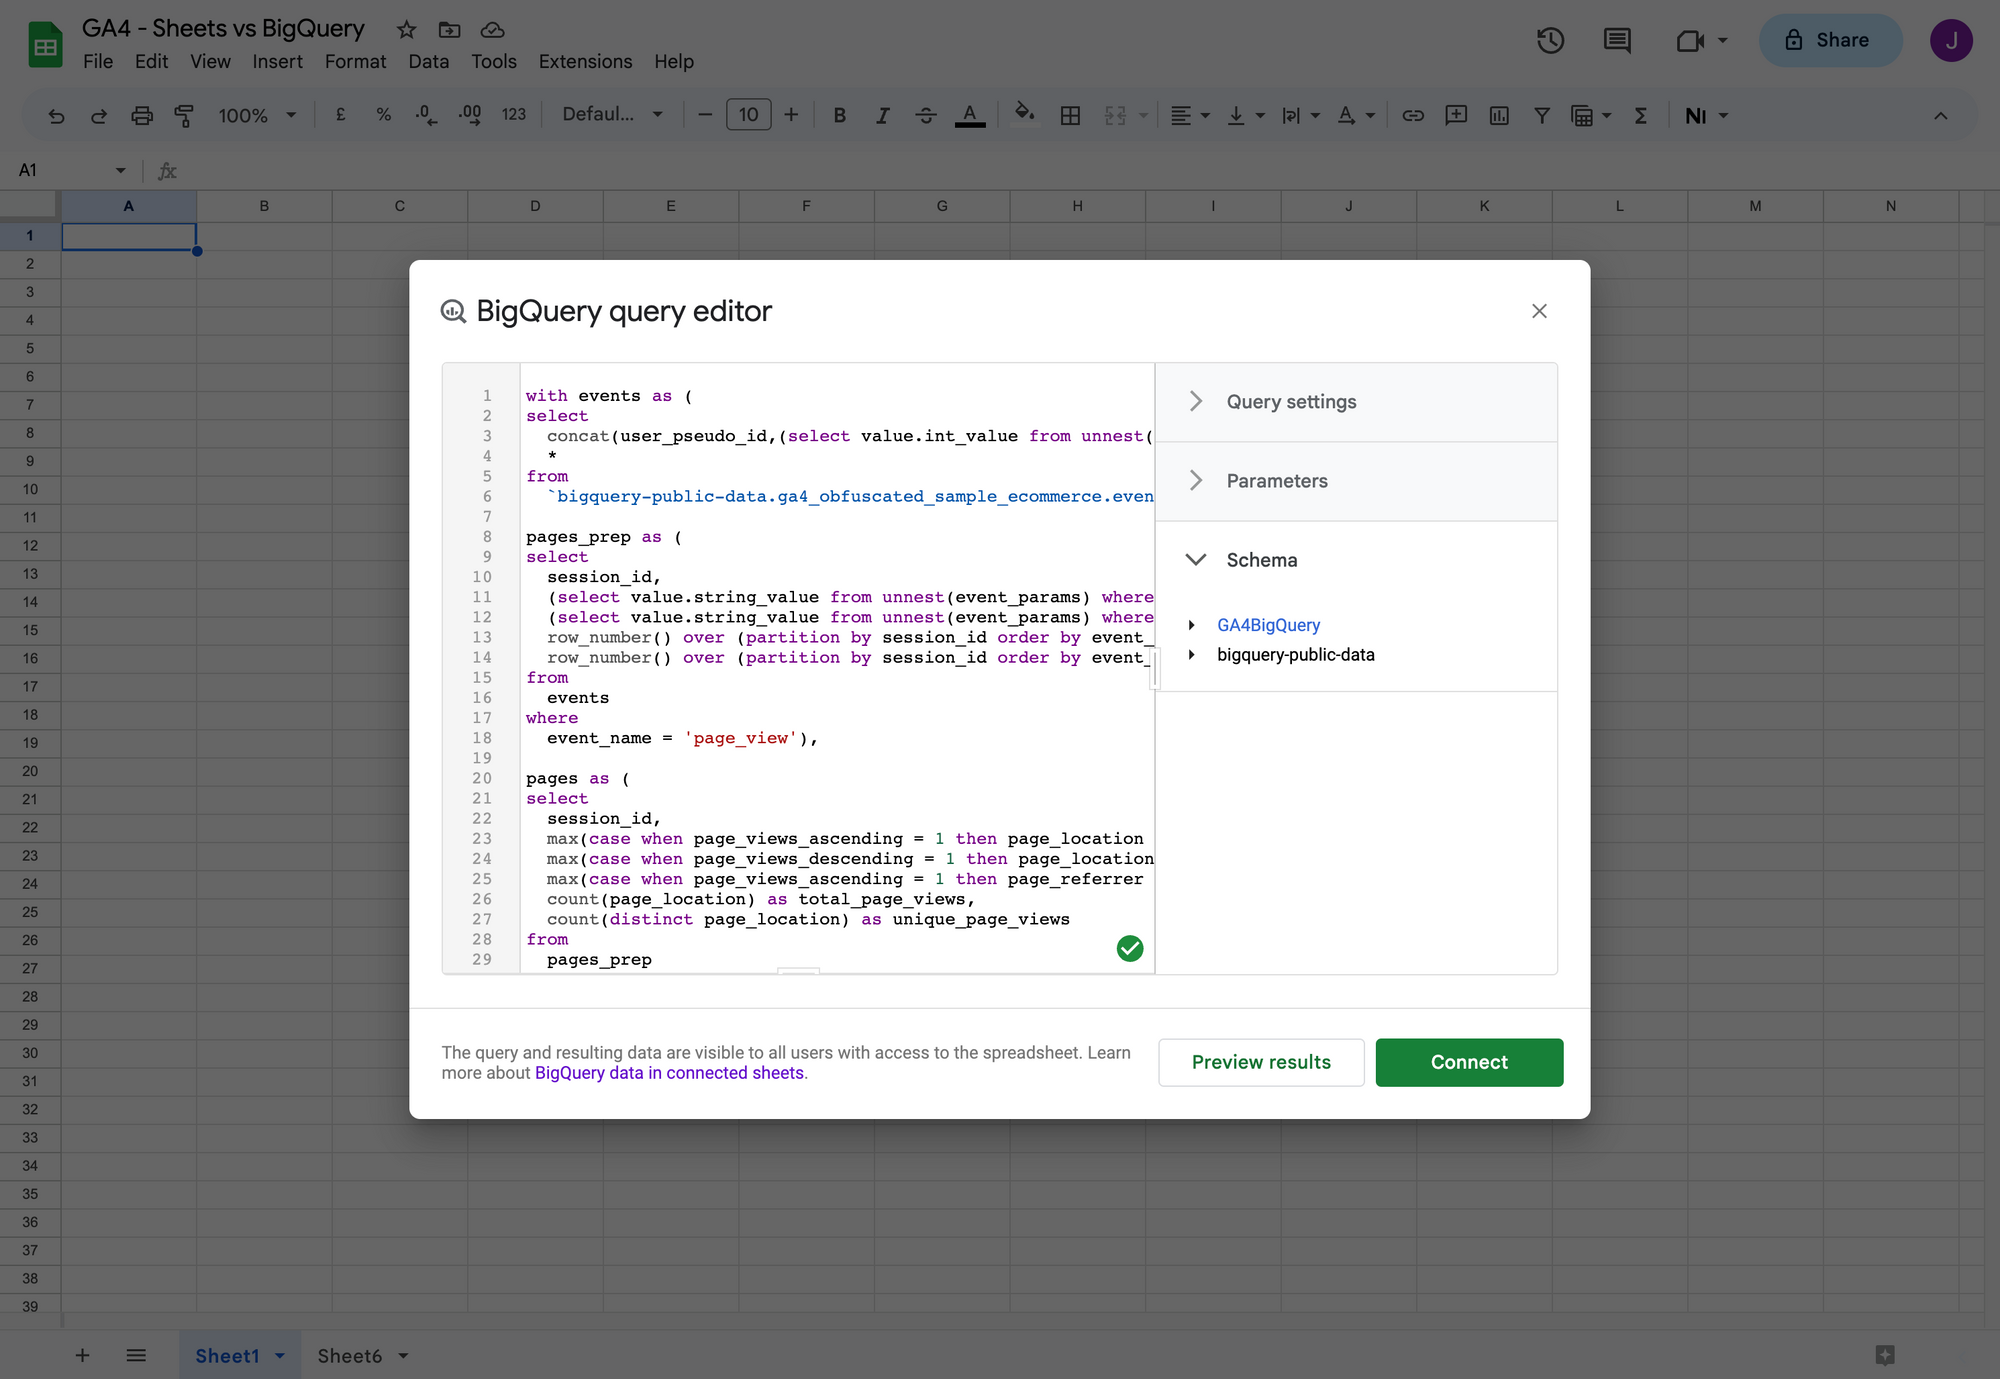
If we use the same (relatively complex) query as in the sessionized event data example above, we will get the same result when it comes to the data. But every interaction in Google Sheets will trigger a query (> 1GB) that could potentially ruin your Google Cloud bill at the end of the month.
Additional sources
- Information about access control
- Connected Sheets video tutorial for end users
Now it's your turn!
I hope you've enjoyed this tutorial and feel a bit more confident to utilise your own Google Analytics data in BigQuery. Drop a line in the comments if you have any questions, feedback or suggestions related to this article.
