How to create a GA4 tech (device, OS & browser) performance report in BigQuery
This article contains a query that you can use to create a custom tech (device, OS & browser) performance report, based on your Google Analytics 4 export data in BigQuery.
This article contains a query that you can use to create a custom tech report, based on your Google Analytics 4 export data in BigQuery.
The result of the query will not be an exact replicate of any report in the GA4 user interface. While designing this report, we took into account:
- the available data fields in GA4 export
- current (GA4) and legacy (GA3/UA) user interface reports
- data definitions according to documentation (if available)
- scope (user / session / event / item)
- common sense
💡
It is expected that the results for this query will not match with any GA4 user interface report. This can occur for a variety of reasons.
This query can be used:
- to create a result table that can be opened in Google Sheets or exported as csv
- to save as a BigQuery table, for further analysis
- to create (and frequently update) a BigQuery table that feeds a dashboard (e.g. Looker Studio)
- to use as a starting point to design your own report
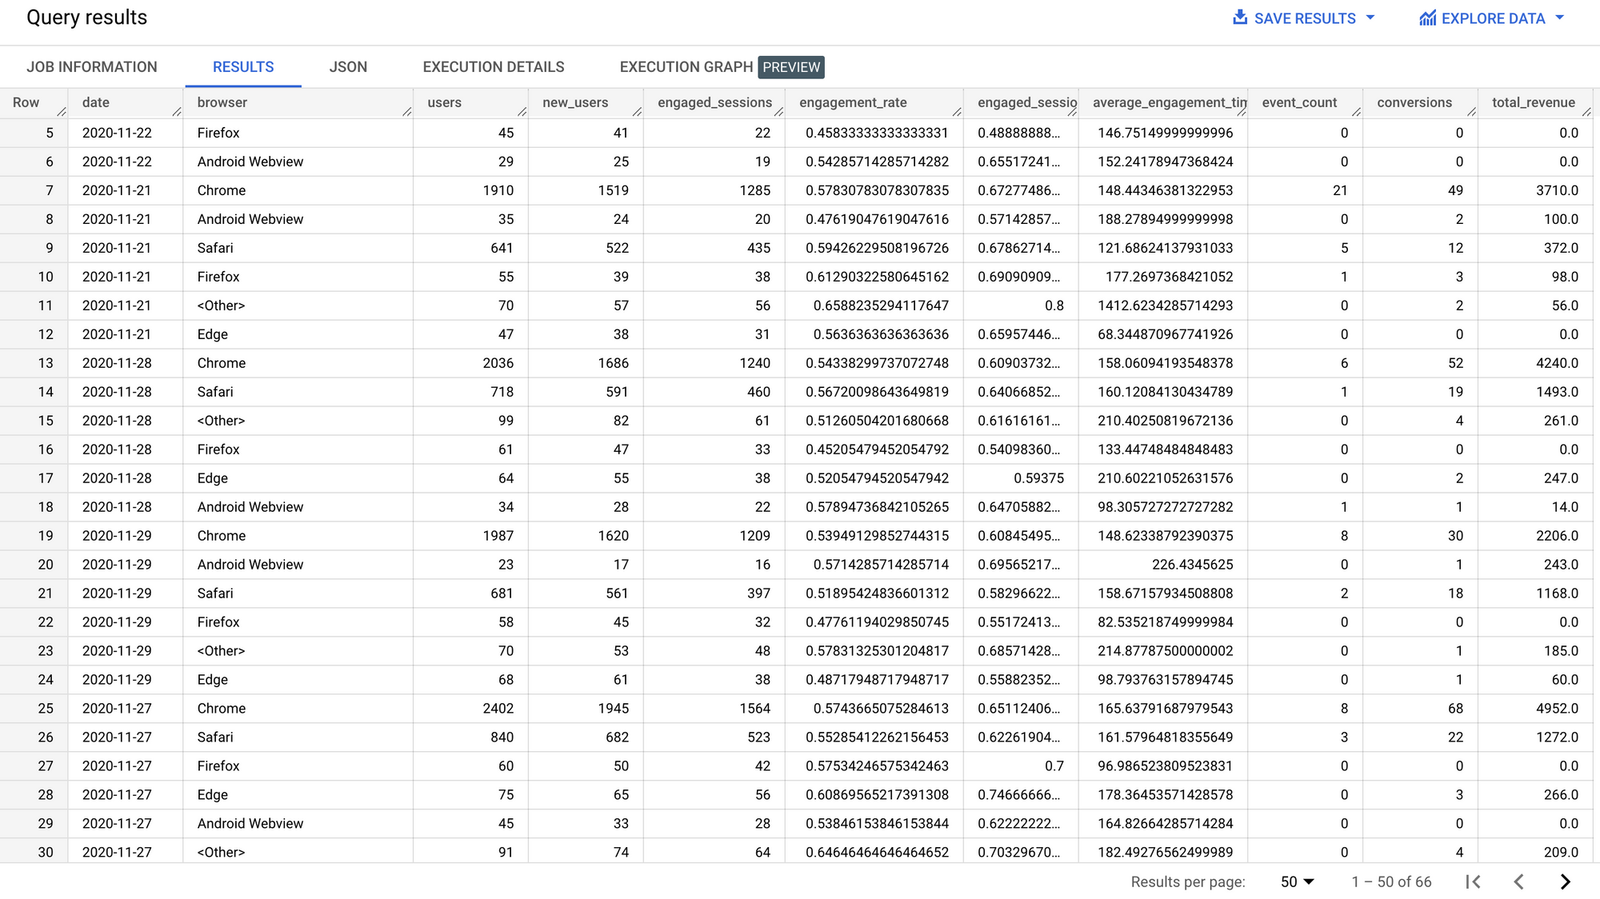
Report dimensions
The report contains the following dimensions:
- date
- device category
- operation system
- operation system version
- browser
- browser version
- mobile brand name
- mobile model name
- mobile marketing name
- mobile os hardware model
Report metrics
The report contains the following metrics:
- users
- new users
- engaged sessions
- engagement rate
- engaged sessions per user
- average engagement time in seconds
- event count
- conversions
- total revenue
