How to create a pivot table with GA4 data in BigQuery
The pivot table is a very popular functionality in spreadsheet tools like Microsoft Excel. In this blog post I will show some SQL code examples of pivot tables that were made using the GA4 data export and the pivot() operator in BigQuery.
The pivot table is a very popular functionality in spreadsheet tools like Microsoft Excel or Google Sheets. Using pivot tables you can quickly aggregate data from large tables in a way that makes sense to you or your stakeholder.
In this blog post I will show some SQL code examples of pivot tables that were made using the GA4 data export and the pivot() operator in BigQuery.
Count of events by page
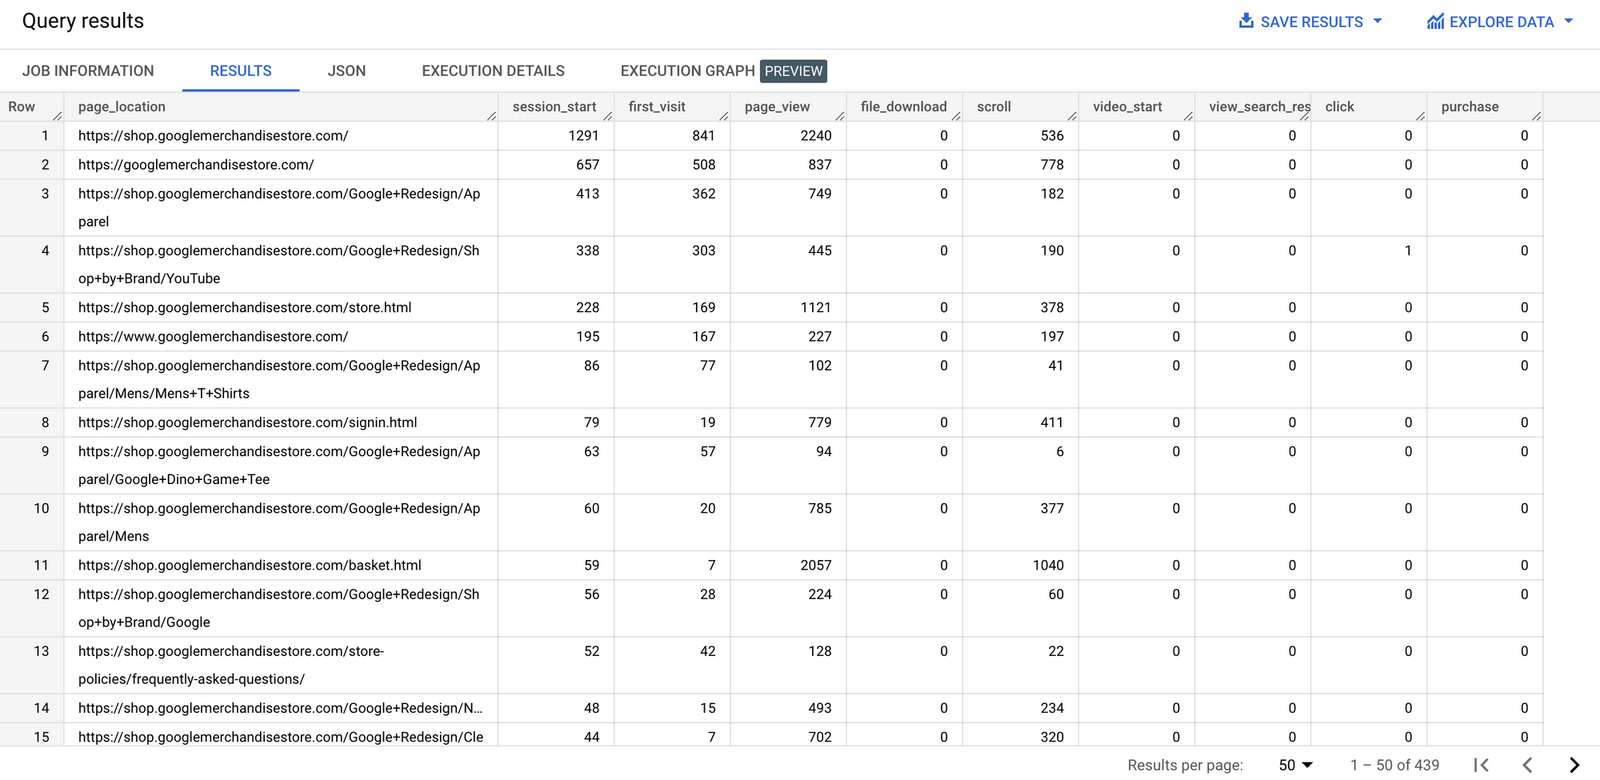
Let's take the following use case to show how to create a pivot table: We want to count all events that were collected by default (using enhanced measurement) in GA4, aggregated by page location and sort the results by the count of session_start event in descending order. To understand how pivot() works, I divided the SQL code in three parts:
1) A subquery where we prepare the source data for the pivot. In this case we select page_location and event_name from a table:
with prep as (
select
   (select value.string_value from unnest(event_params) where key = 'page_location') as page_location,
   event_name
from
   `bigquery-public-data.ga4_obfuscated_sample_ecommerce.events_20201130`)
2) The main query, where we select both fields from the subquery. Then we add the pivot() operator and optionally an order by:
select
   *
from
   prep
pivot ()
order by
   session_start desc
3) The SQL logic to put between the parentheses of the pivot() operator. The aggregation method for the columns is count(), the field we want to count is event_name and the pivot will apply to the event_name values provided in in(). Unfortunately we can only provide static values here, such as strings or numbers, and there is no way to select the values dynamically:
count(event_name)
for
   event_name
in ('session_start',
    'first_visit',
    'page_view',
    'file_download',
    'scroll',
    'video_start',
    'view_search_results',
    'click',
    'purchase')
If we put everything together, the query and the result look like this:
with prep as (
select
   (select value.string_value from unnest(event_params) where key = 'page_location') as page_location,
   event_name
from
   `bigquery-public-data.ga4_obfuscated_sample_ecommerce.events_20201130`)

select
   *
from
   prep
pivot (
   count(event_name)
for
   event_name
in ('session_start',
   'first_visit',
   'page_view',
   'file_download',
   'scroll',
   'video_start',
   'view_search_results',
   'click',
   'purchase'))
order by
   session_start desc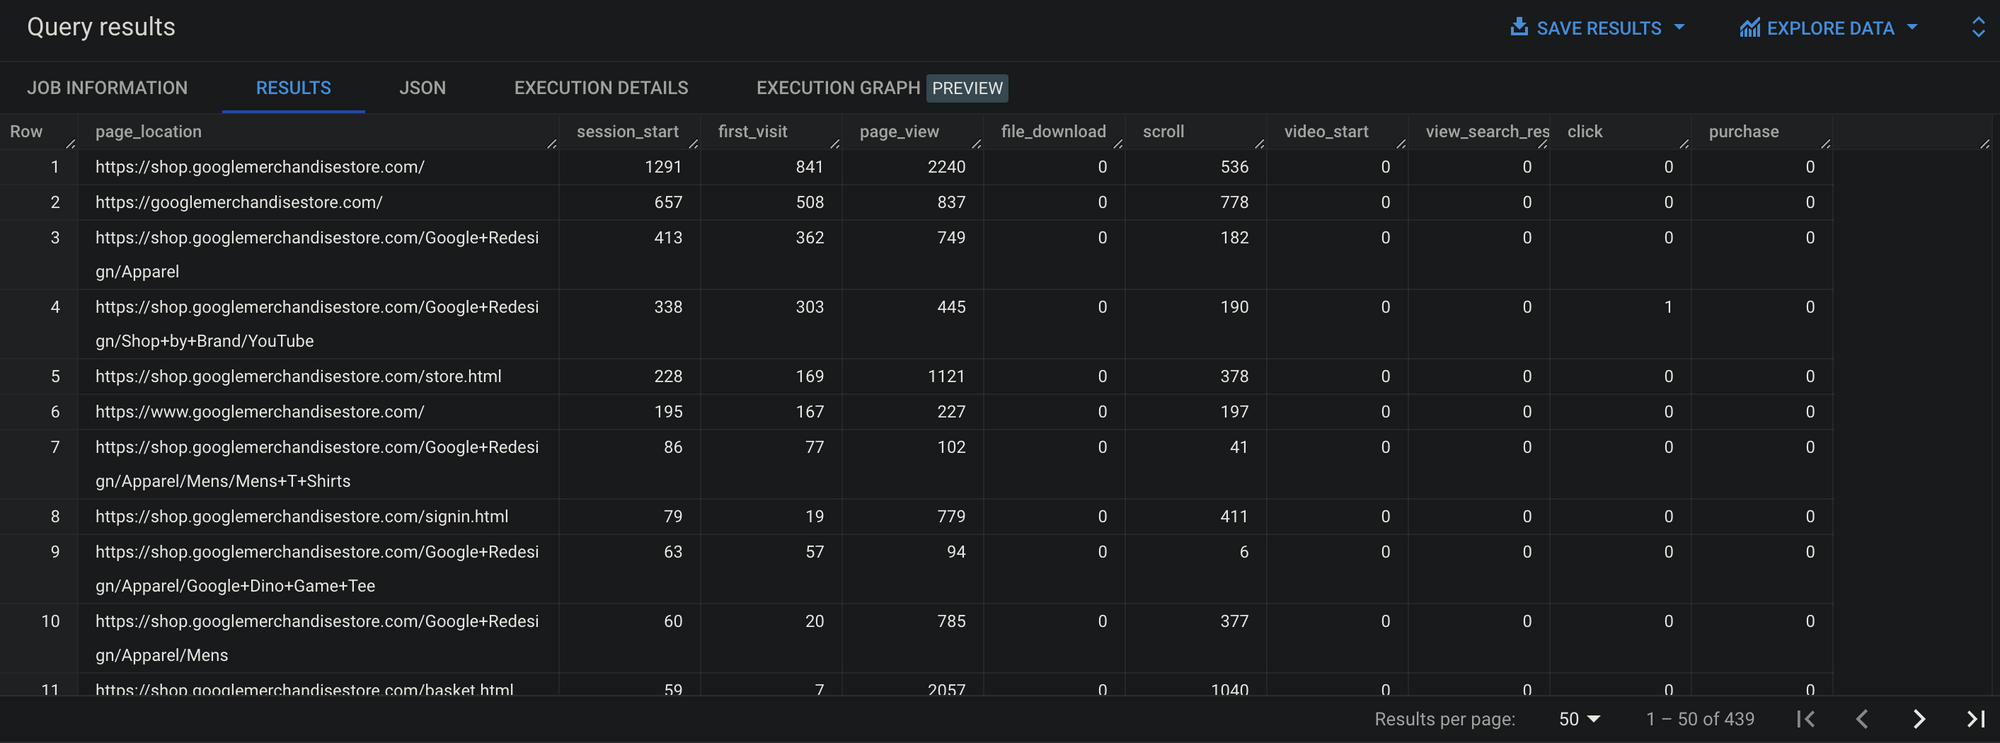
Funnel metrics for ecommerce items
Another use case could be that we want to have a list of all ecommerce products and see how often any item is viewed, added to cart and purchased. Because we aggregate by counting distinct concatenation of user_pseudo_id and session_id, we need to make sure those are available through our subquery.
with prep as (
select
   item.item_name,
   user_pseudo_id,
   (select value.int_value from unnest(event_params) where key = 'ga_session_id') as session_id,
   event_name
from
   `bigquery-public-data.ga4_obfuscated_sample_ecommerce.events_202011*`,
   unnest(items) as item)

select
   *
from
   prep
pivot (
   count(distinct concat(user_pseudo_id,session_id))
for
   event_name
in ('view_item','add_to_cart','purchase'))
order by
   view_item desc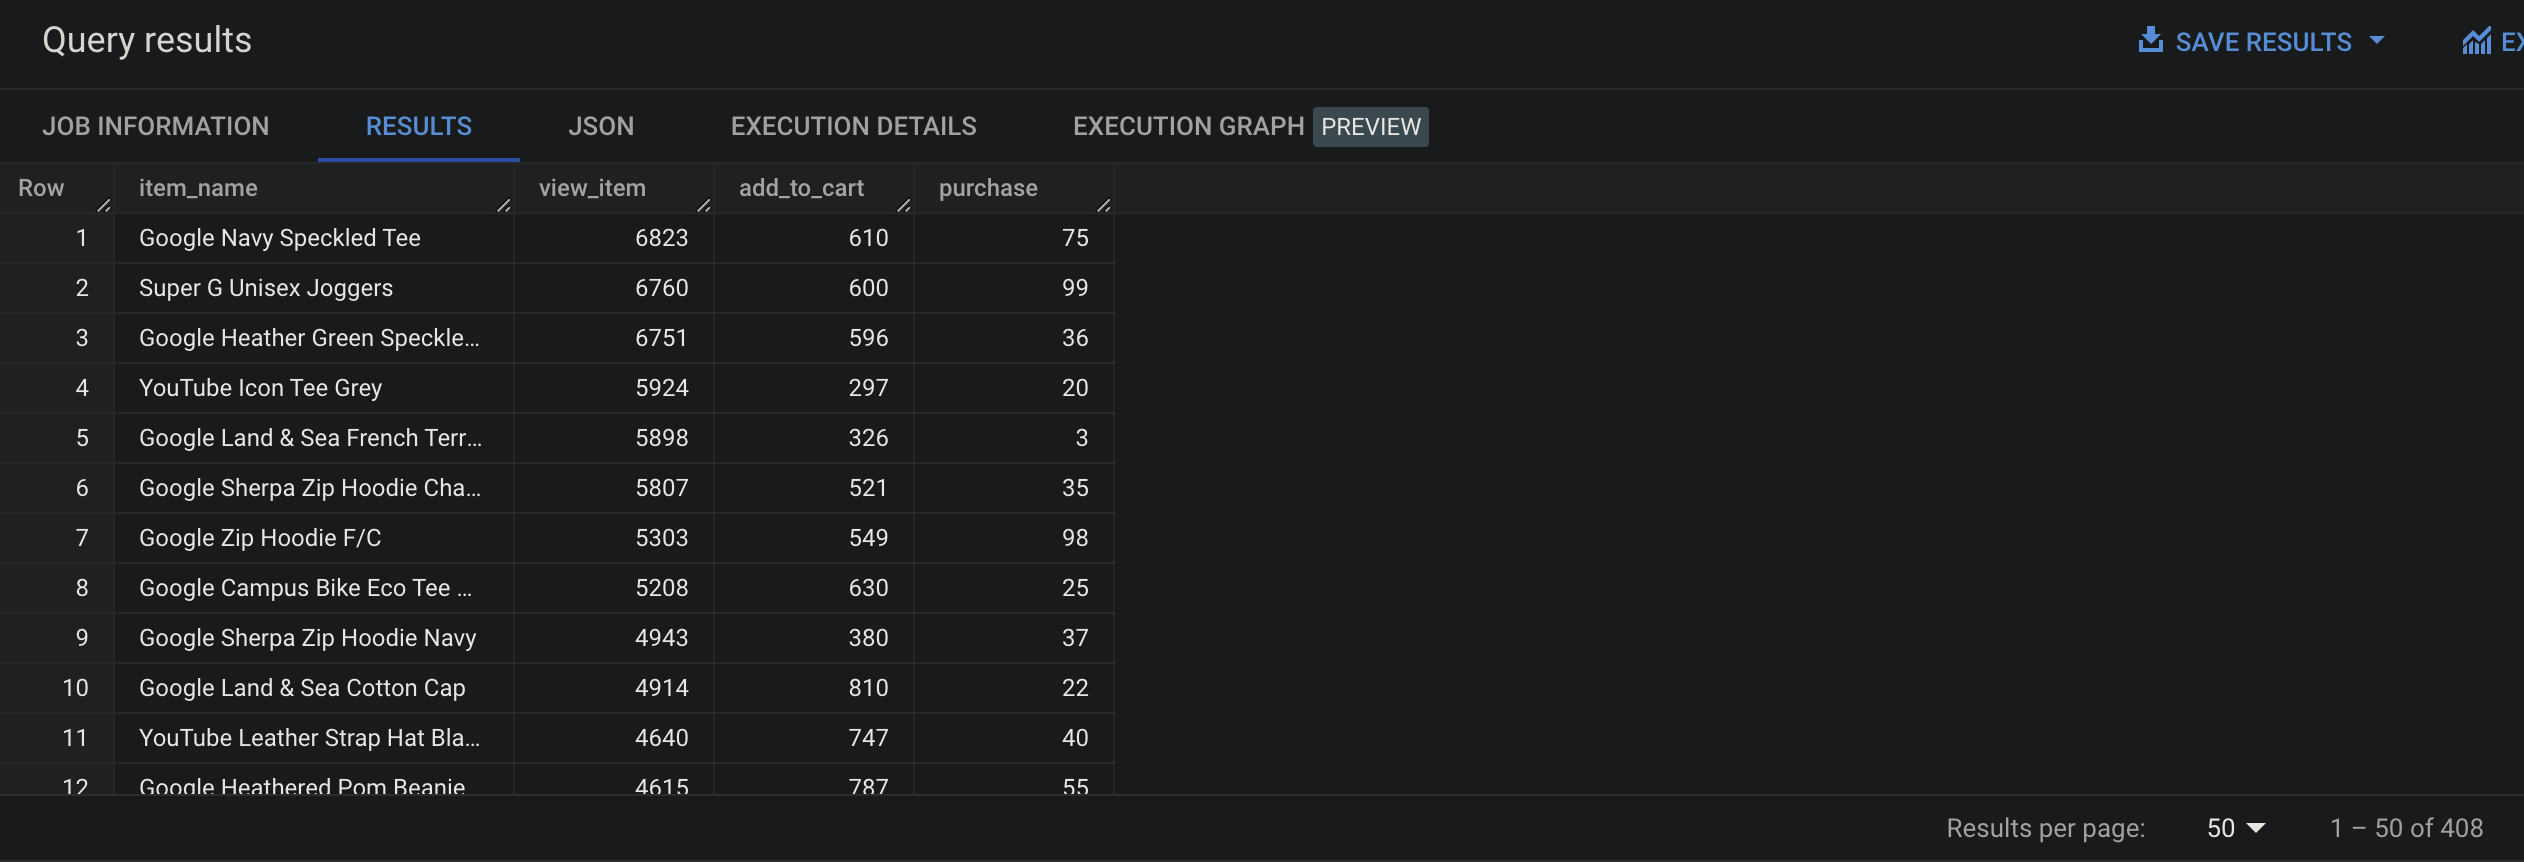
Purchase revenue by first acquisition medium
I will leave you with one last use case and example, to give you an idea of the power of the pivot() operator. First we extract the isoweek (starting on Monday) from the event_date and select medium and purchase_revenue as well. Then we sum the revenue for all weeks selected in in() and group it by medium. Optionally you can give the weeks selected an alias, see example of week 47:
with prep as (
select
   traffic_source.medium,
   extract(isoweek from parse_date("%Y%m%d",event_date)) as week,
   ecommerce.purchase_revenue
from
   `bigquery-public-data.ga4_obfuscated_sample_ecommerce.events_*`
where
  event_name = 'purchase'
  and _table_suffix between '20201116' and '20210124')

select
   *
from
   prep
pivot (
   sum(purchase_revenue)
for
   week
in (47 as week_47,48,49,50,51,52,53,1,2,3))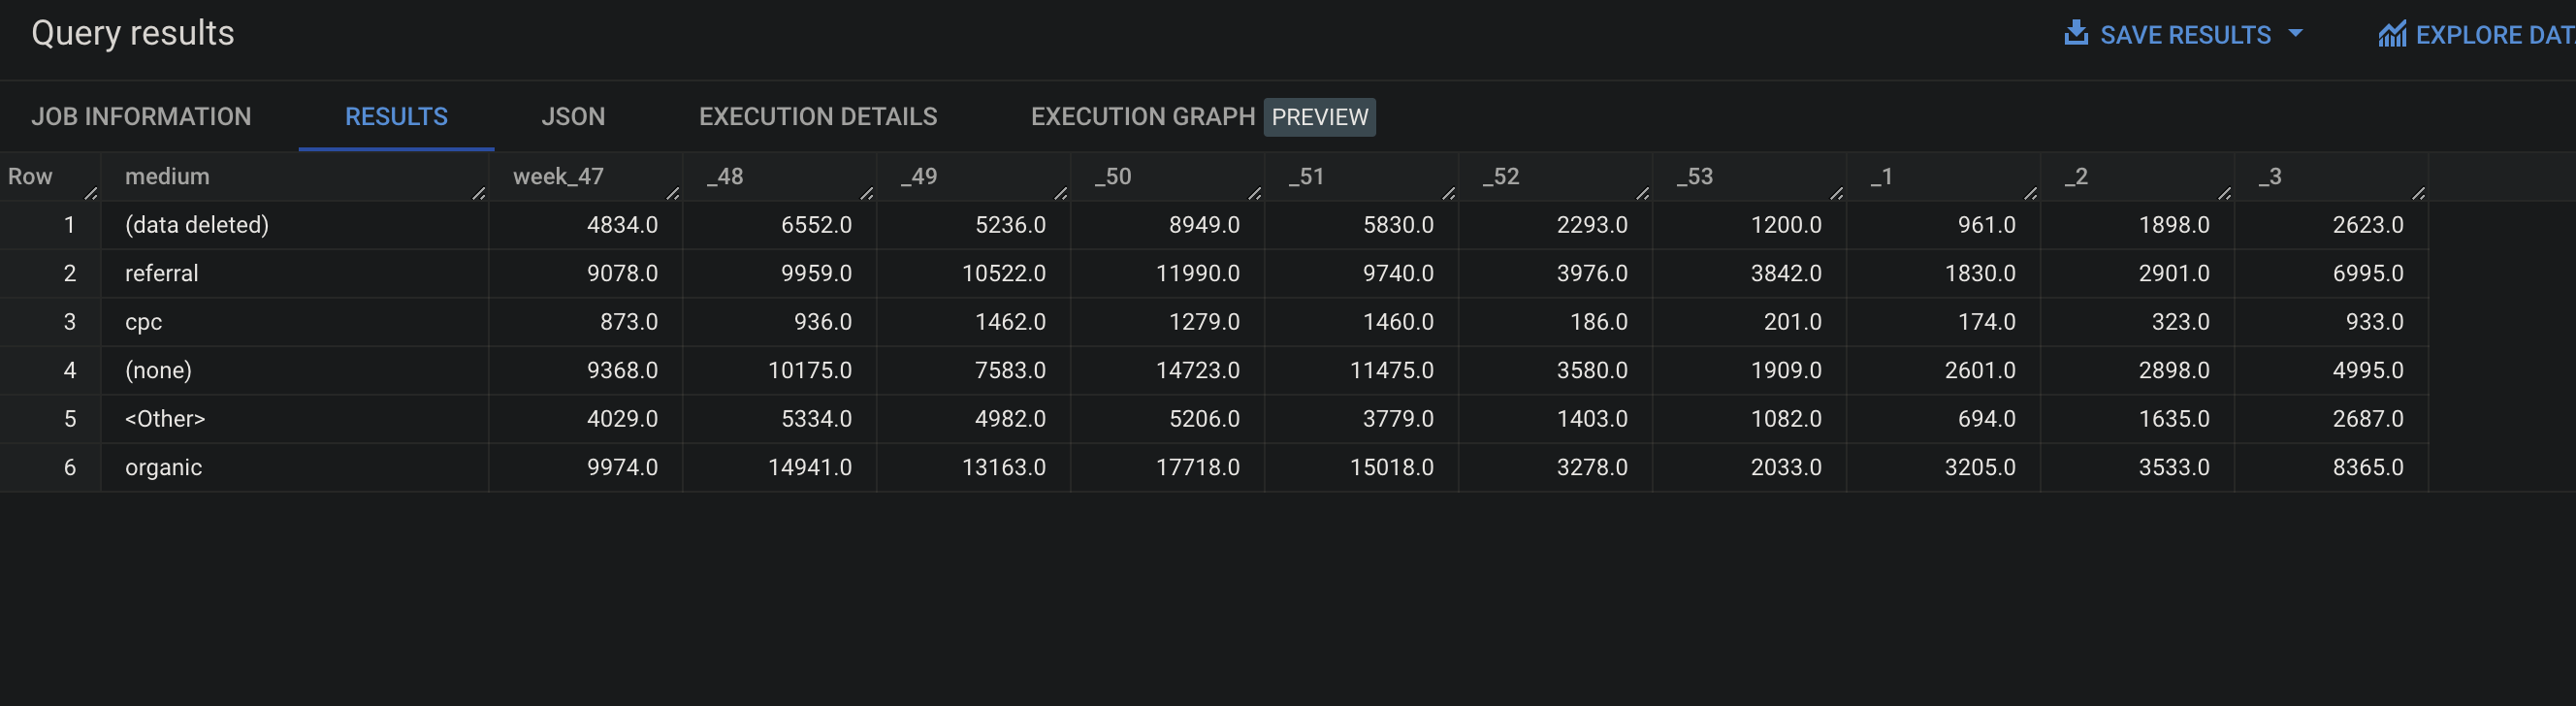
Now it's your turn!
I hope you've enjoyed this and feel a bit more confident to utilise your own Google Analytics data in BigQuery. Drop a line in the comments if you have any questions, feedback or suggestions related to this article.
