How to create a GA4 funnel exploration table with completion and abandonment rates in BigQuery
In this tutorial, we will guide you through the steps to create a GA4 user interface style funnel exploration table in BigQuery, including calculating completion and abandonment rates.
As a website or app owner, understanding user behavior and conversion rates is crucial to optimizing your business goals. With GA4 you can create custom funnels to track user behavior and measure conversion and drop off rates.
In this tutorial, we will guide you through the steps to create a GA4 user interface style funnel exploration table in BigQuery, including calculating completion and abandonment rates.
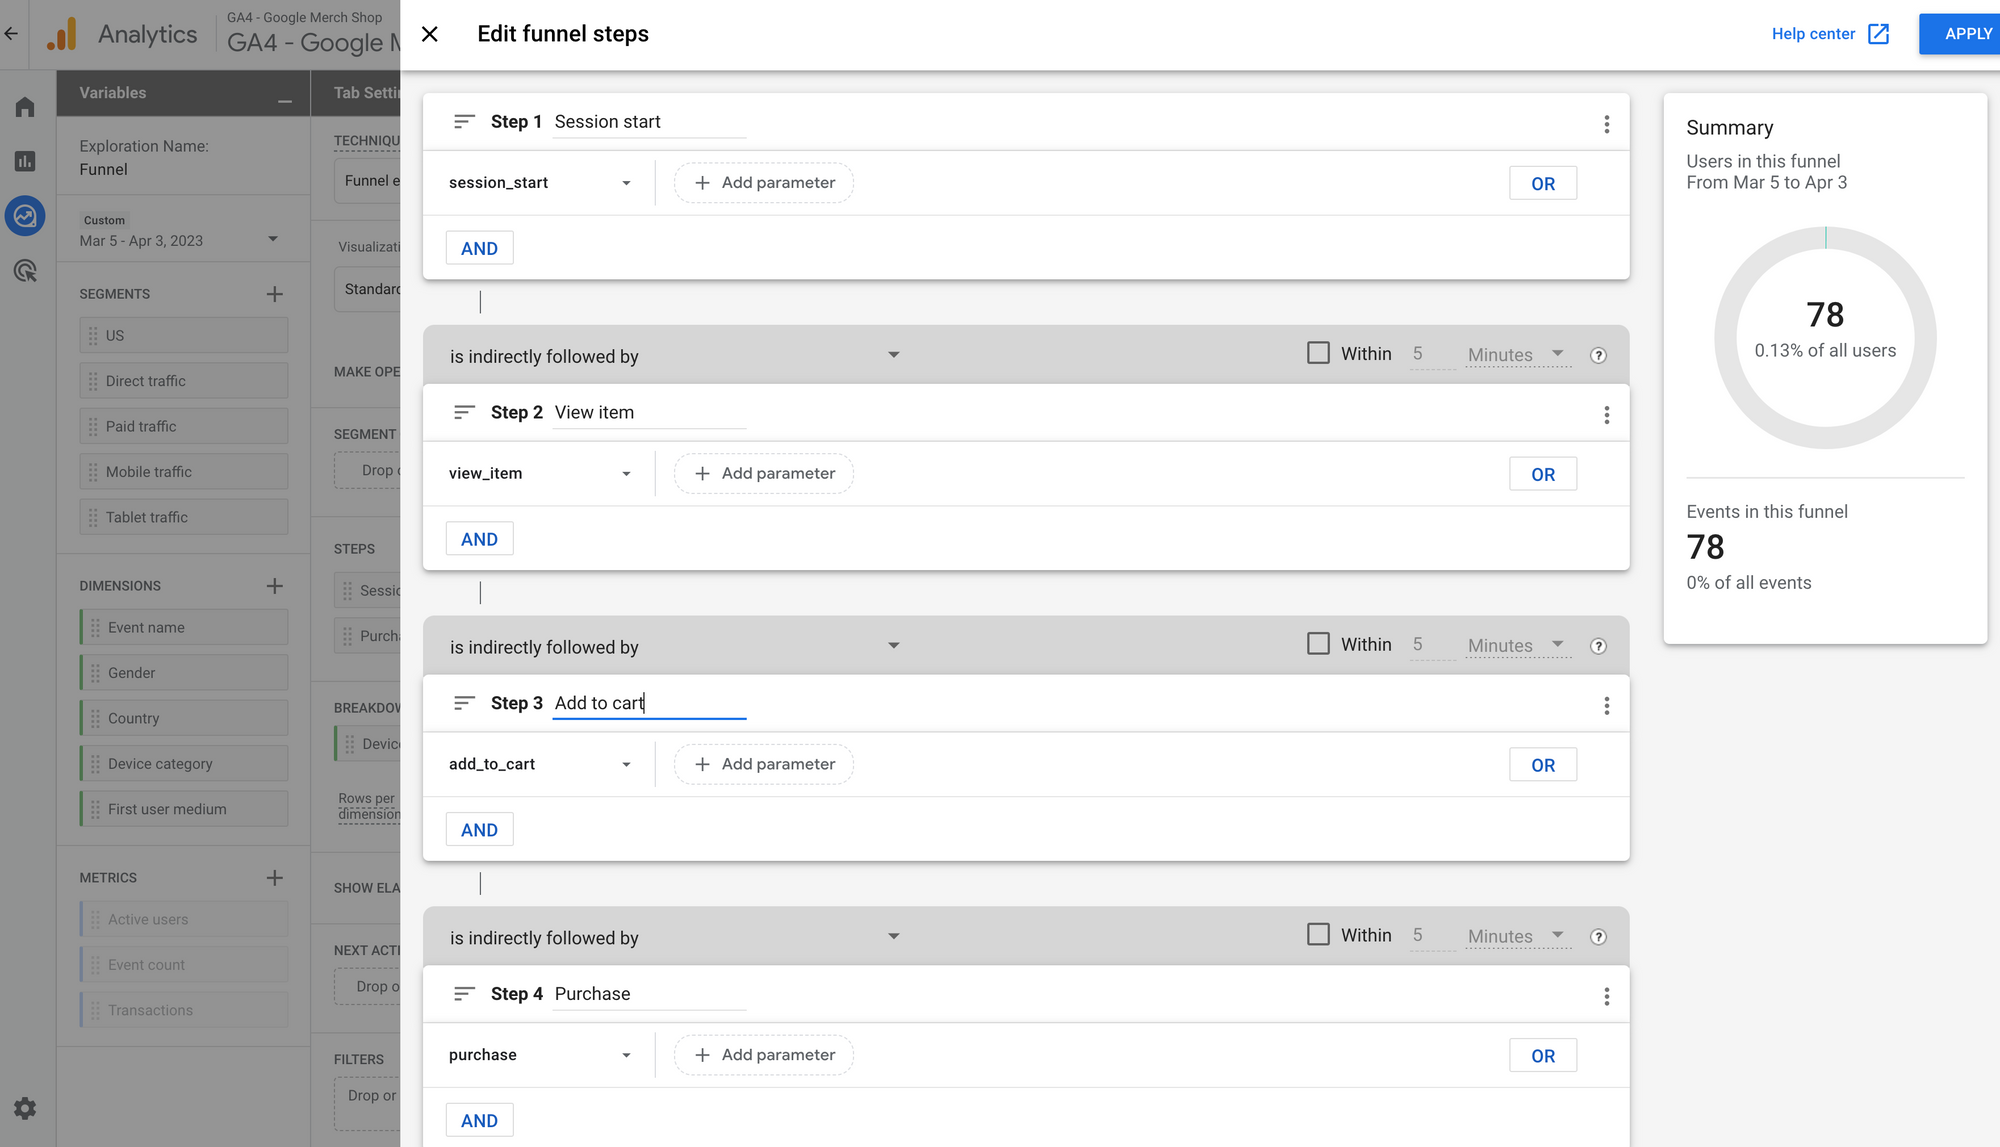
GA4 funnel configuration example
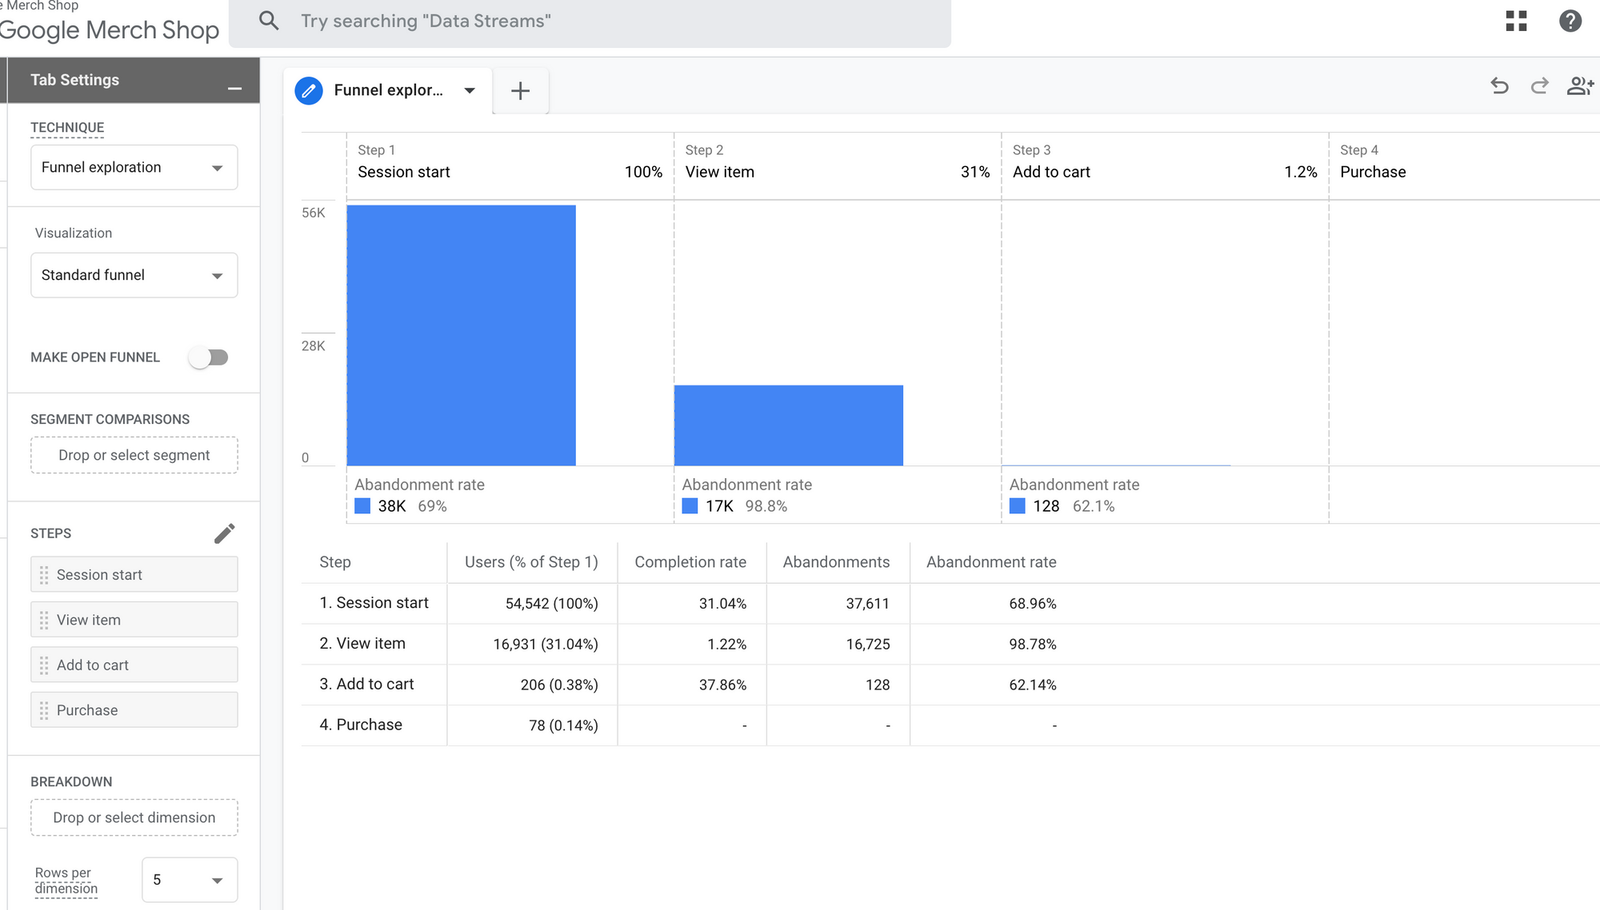
When creating a funnel exploration in GA4, you can define the funnel steps at will. In this tutorial we will use the events session_start, view_item, add_to_cart and purchase.
When applied this will result in a funnel exploration graph with a table. The goal of this tutorial is to recreate the table using BigQuery.
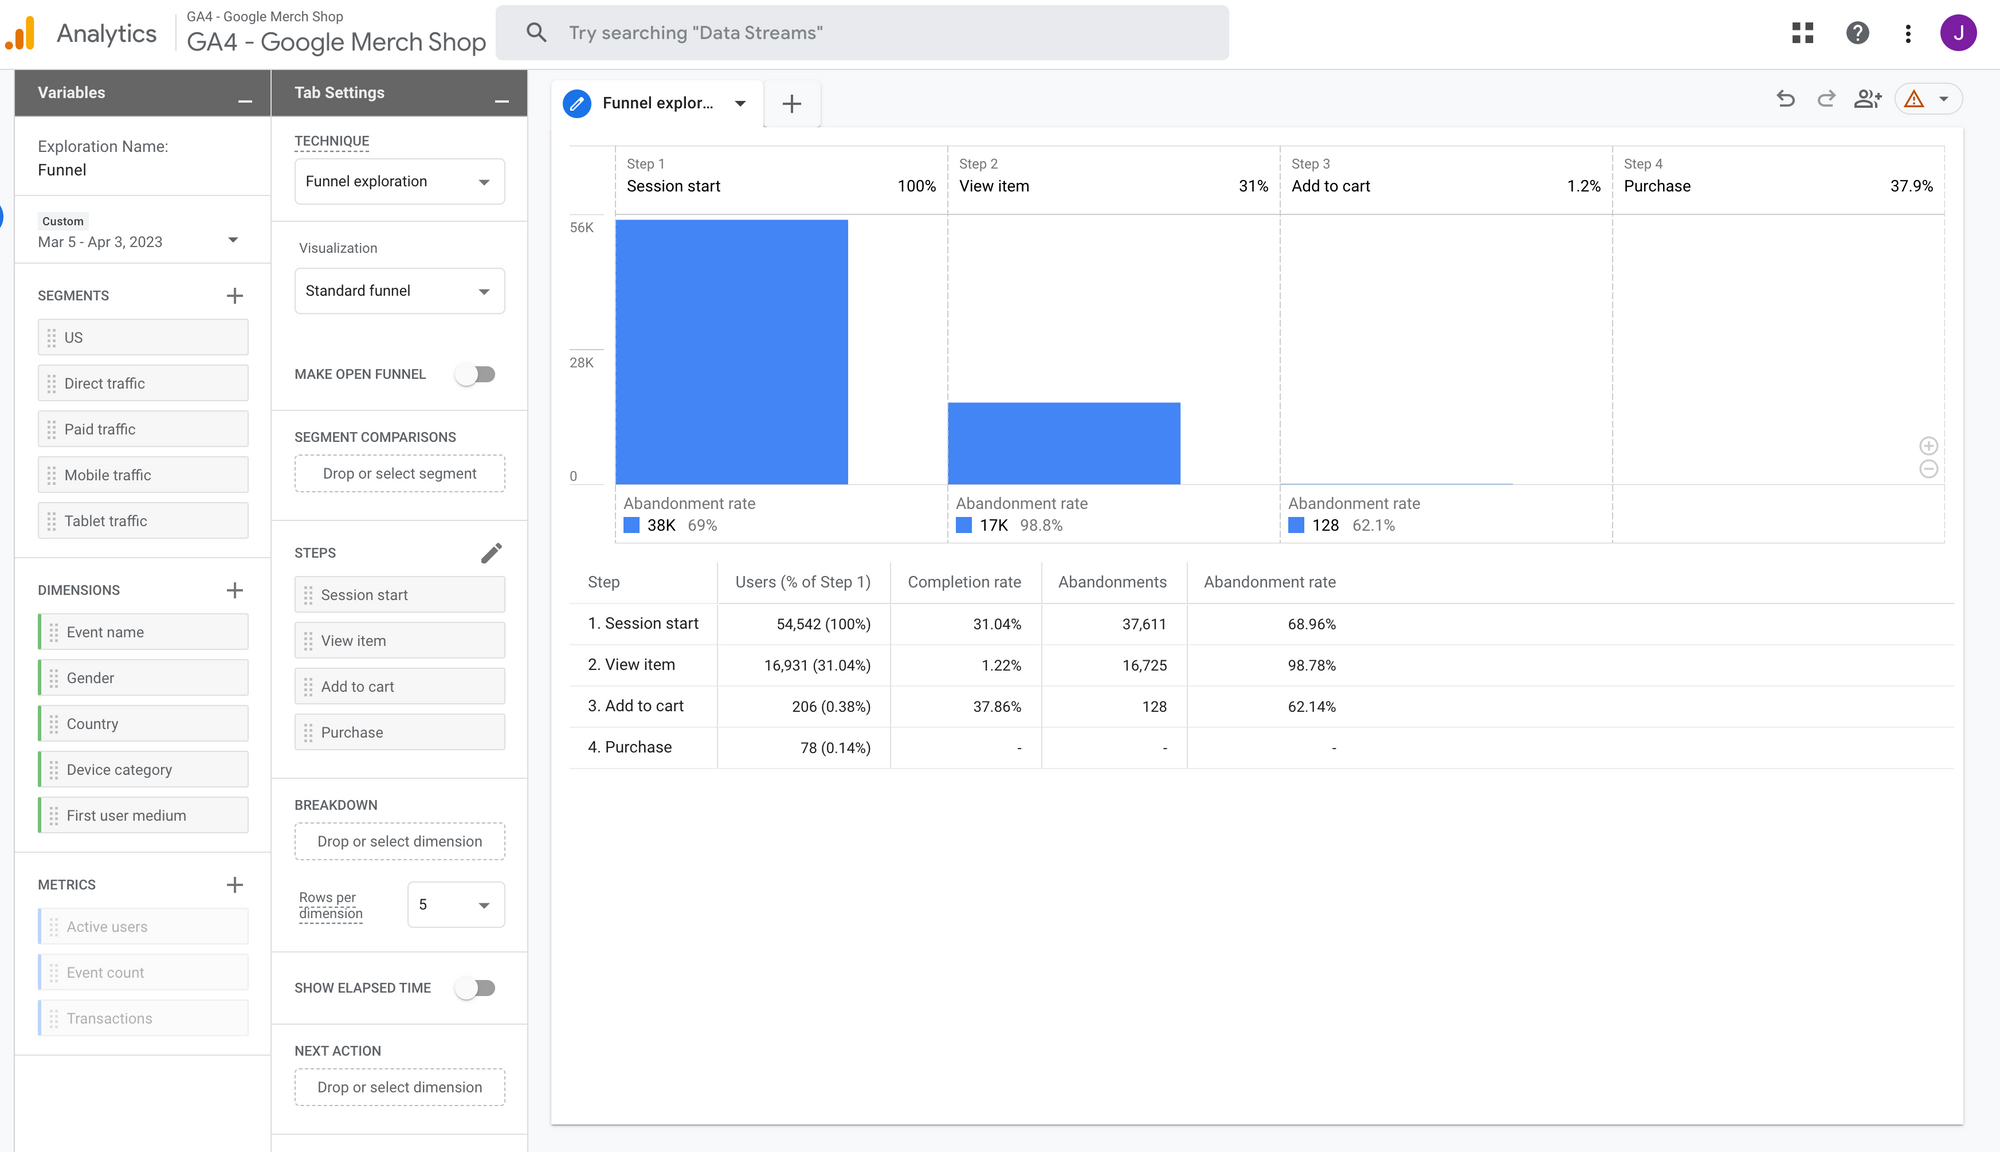
Each row represents a step in the funnel, and the columns provide information about the number of users who completed the step, the percentage of users who completed the step relative to the previous step, the completion rate, the number of users who abandoned the step, and the abandonment rate.
BigQuery result example
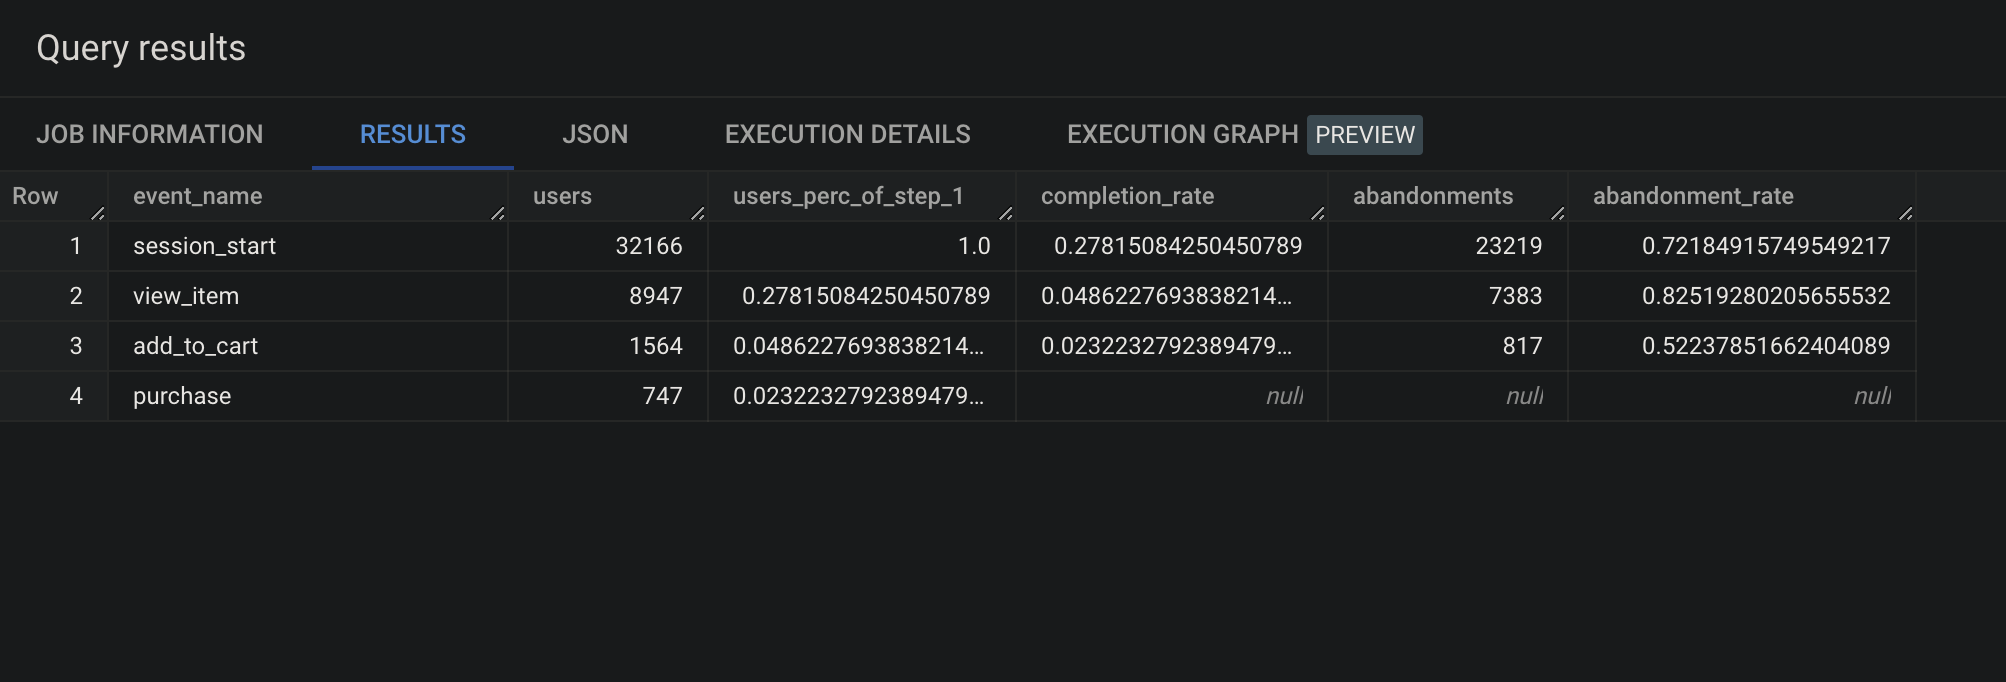
In the result table we will get when using the final query at the end of the tutorial, the first step is session_start, which had 32,166 users.
The second step is view_item, which had 8,947 users, representing 27.8% of the users who started a session. The completion rate for this step is 4.9%, meaning that 4.9% of the users who viewed an item went on to the next step add_to_cart. However, the abandonment rate for this step is quite high at 82.5%, indicating that the majority of users who viewed an item did not add it to their cart.
The third step is add_to_cart, which had 1,564 users, representing 4.9% of the users who viewed an item. The completion rate for this step is 2.3%, meaning that only 2.3% of the users who added an item to their cart went on to the next (and final) step, purchase.
The abandonment rate for this step is 52.2%, indicating that more than half of the users who added an item to their cart did not complete the purchase. There is no completion rate or abandonment rate for the purchase step since this is the final step in the funnel.
In this tutorial you will learn how to:
- create a GA4 user interface style funnel exploration table
- how to calculate metrics like completion rate and abandonment rate
