How to create a GA4 user retention cohort table in BigQuery (and visualise it in Looker Studio)
In this tutorial, we will walk you through the process of creating a user retention cohort table in BigQuery using Google Analytics 4 data, and visualise the data in Looker Studio. A retention cohort analysis is a powerful way to understand how well your app or website is retaining users over time.
In this tutorial, we will walk you through the process of creating a user retention cohort table in BigQuery using Google Analytics 4 data. A retention cohort analysis is a powerful way to understand how well your app or website is retaining users over time.
What is user retention?
User retention is a crucial metric in the digital marketing world. It will give you valuable insights into how users interact with your app or website, and help you make informed decisions to improve retention.
A user retention cohort table or chart can be very helpful to:
- identify which marketing campaigns are most effective at driving customer retention
- analyse the behaviour of users who have recently churned to understand why they left
- understand how user engagement and retention changes over time for different segments of customers
It's important to note, the rate of user retention can vary depending on the type of website, the content, and the audience. Some websites like news, or social media platforms may have a short visit duration, but high return rate. For other websites, like e-commerce, the opposite may be true, longer visit duration but a low return rate.
What is a cohort?
A cohort is a group of users who share a common characteristic, such as signing up for a service at the same time, or starting to use a website during the same time period. Each row of the chart represents a different cohort and each column represents a different time period. A cohort chart will typically display the number of users from each cohort who are still active or engaged on the website over time.
By gaining a deeper understanding of how users engage with your product over time, you can optimise your retention strategy to keep valuable users coming back, and make data-driven decisions on how to improve overall performance.
GA4 cohort exploration
The cohort exploration is one of the template charts in the GA4 user interface. If you select it, it will show you the retention for active users over a time window of five weeks, for users who had any event.
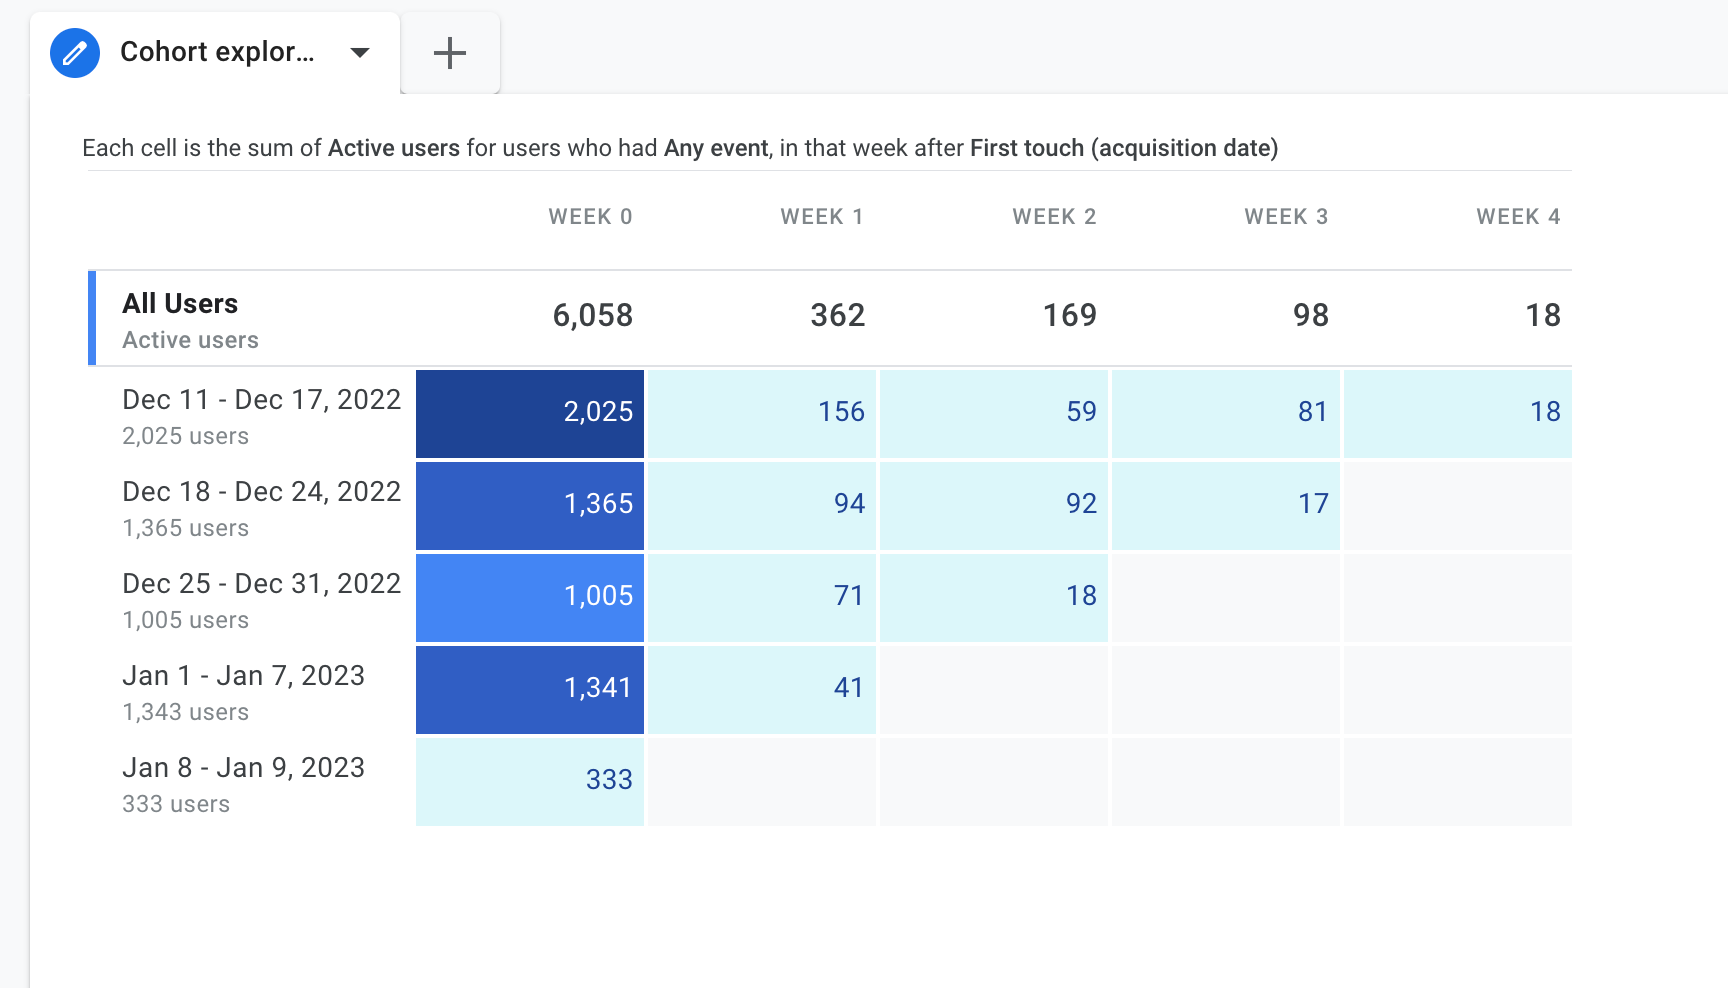
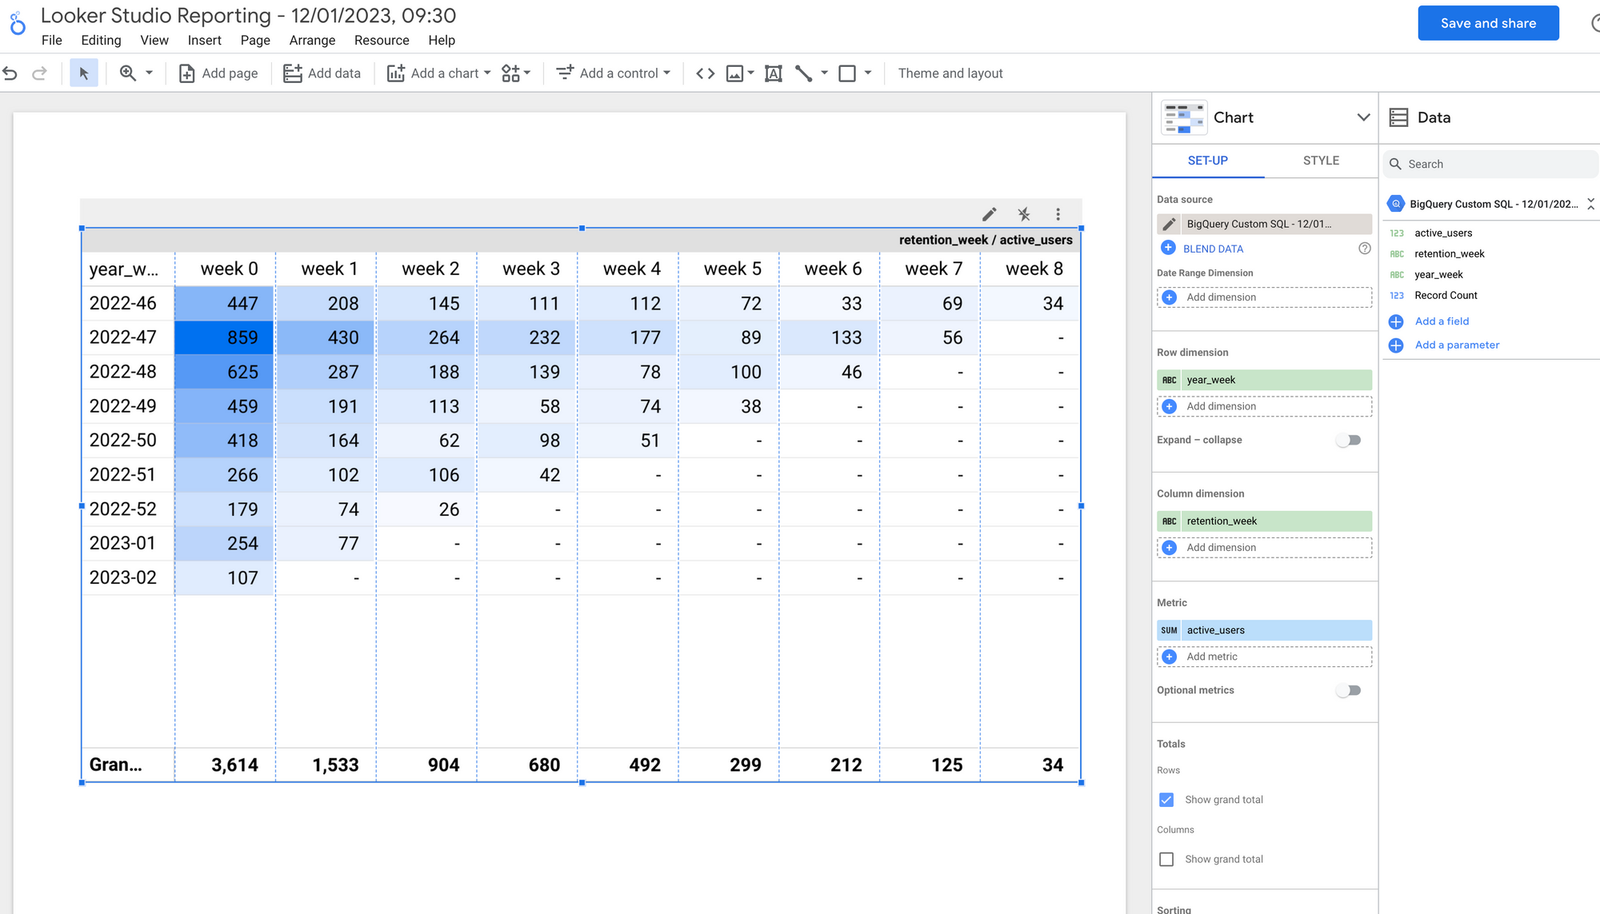
In this tutorial we will create a similar table in BigQuery, to visualise it in Looker Studio afterwards. Be aware that the actual results can differ from the numbers you see in the GA4 user interface.
Advanced usage
If you really want to spice up your analysis, you can add return criteria (like a transaction or conversion event), combine this technique with user stitching (based on a user id), to calculate user retention over all devices your users use to engage with your website or app.
You could also create custom user segments for your cohort table. Or replace the default session number with your own custom session definition.
Let's query!
In this tutorial, you will learn how to:
- create a user retention cohort table in BigQuery using Google Analytics 4 data
- define the building blocks needed from the GA4 export data to be able to get to the desired result
- visualize your cohort data in Looker Studio
