How to create a GA4 ecommerce transactions performance report in BigQuery
This article contains a query that you can use to create a custom ecommerce transactions performance report, based on your Google Analytics 4 export data in BigQuery.
This article contains a query that you can use to create a custom ecommerce transactions performance report, based on your Google Analytics 4 export data in BigQuery.
The result of the query will not be an exact replicate of any report in the GA4 user interface. While designing this report, we took into account:
- the available data fields in GA4 export
- current (GA4) and legacy (GA3/UA) user interface reports
- data definitions according to documentation (if available)
- scope (user / session / event / item)
- common sense
💡
It is expected that the results for this query will not match with any GA4 user interface report. This can occur for a variety of reasons.
This query can be used:
- to create a result table that can be opened in Google Sheets or exported as csv
- to save as a BigQuery table, for further analysis
- to create (and frequently update) a BigQuery table that feeds a dashboard (e.g. Looker Studio)
- to use as a starting point to design your own report
Report dimensions
The report contains the following dimensions:
- date
- transaction id
- transaction timestamp
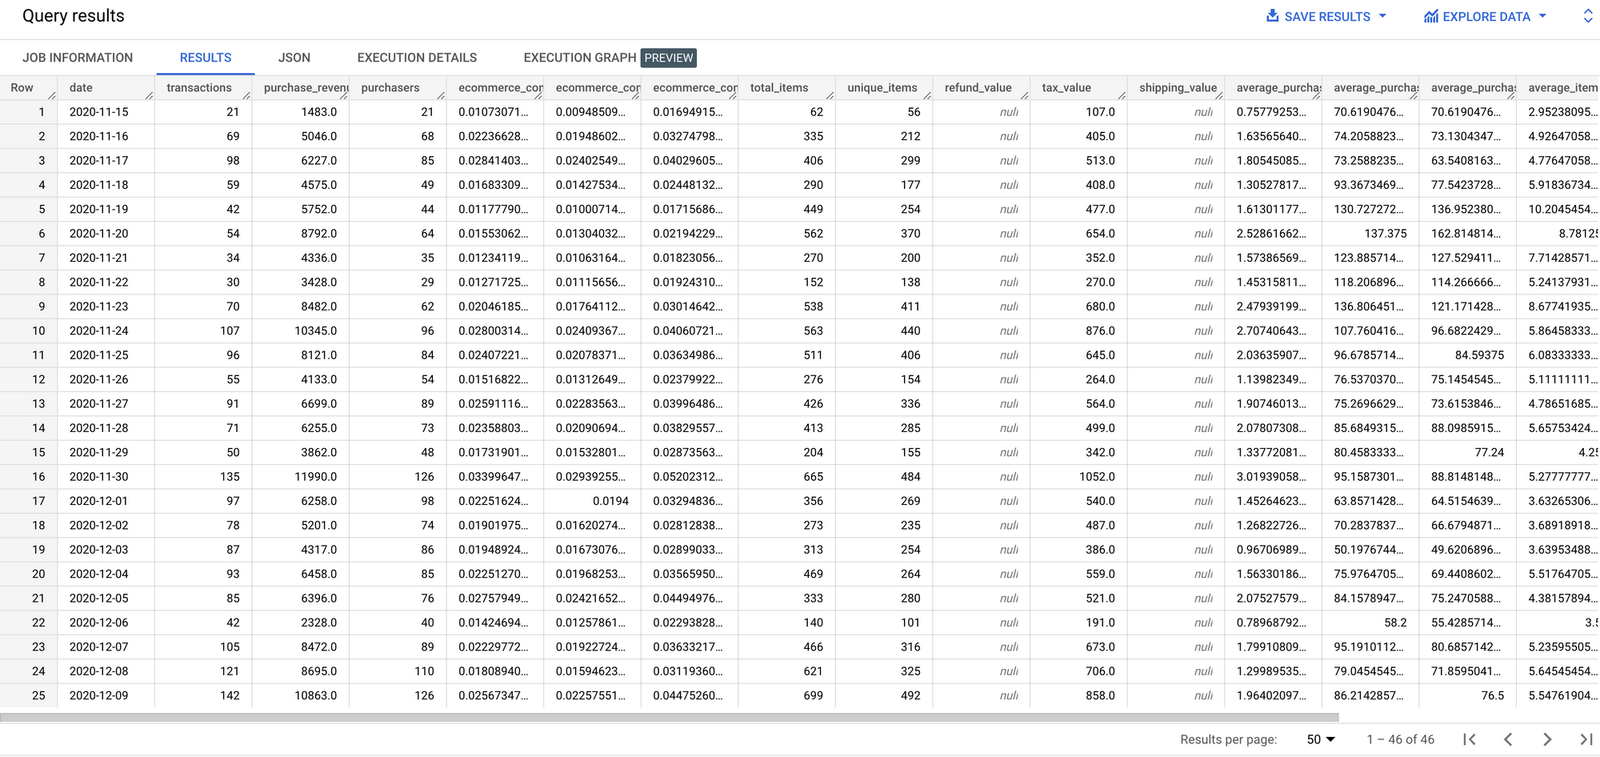
Report metrics
The report contains the following metrics:
- transactions
- purchase revenue
- purchasers
- ecommerce conversion rate users
- ecommerce conversion rate all sessions
- ecommerce conversion rate engaged sessions
- total items
- unique items
- refund value
- tax value
- shipping value
- average purchase revenue per user
- average purchase revenue per purchaser
- average purchase revenue per transaction
- average items per purchaser
- average items per transaction
- average unique items per purchaser
- average unique items per transaction
