Why the landing page report in GA4 sucks and how to fix it in BigQuery (GA3 style)
This tutorial discusses the flaws of the current landing page report in GA4 and offers a solution by using GA4 export data in BigQuery to create a sessionized landing page report, inspired by GA3.

One of the pain points for Google Analytics 4 users who migrated from Universal Analytics (GA3), is the (un)availability of standard reports in the user interface. Even when a report is finally added, like recently the landing page report, the choices that have (or have not) been made when implementing it are hard to understand.
In this tutorial we will look at the flaws of the current GA4 landing page report, at the time of writing, and we will spin up the GA4 export data in BigQuery to create our own customised landing page report, inspired by the GA3 landing page report, which could be used to monitor and optimise your SEO and acquisition strategy.

Views vs sessions
The main reason why the GA4 landing page is suboptimal - at least compared to the same report in GA3 - is that you would expect to see sessions as the main metric to count landing pages. Why? Because every website visit (whatever your definition of a session entails) should only have one landing page (or start page, if you decide to split sessions based on user actions).
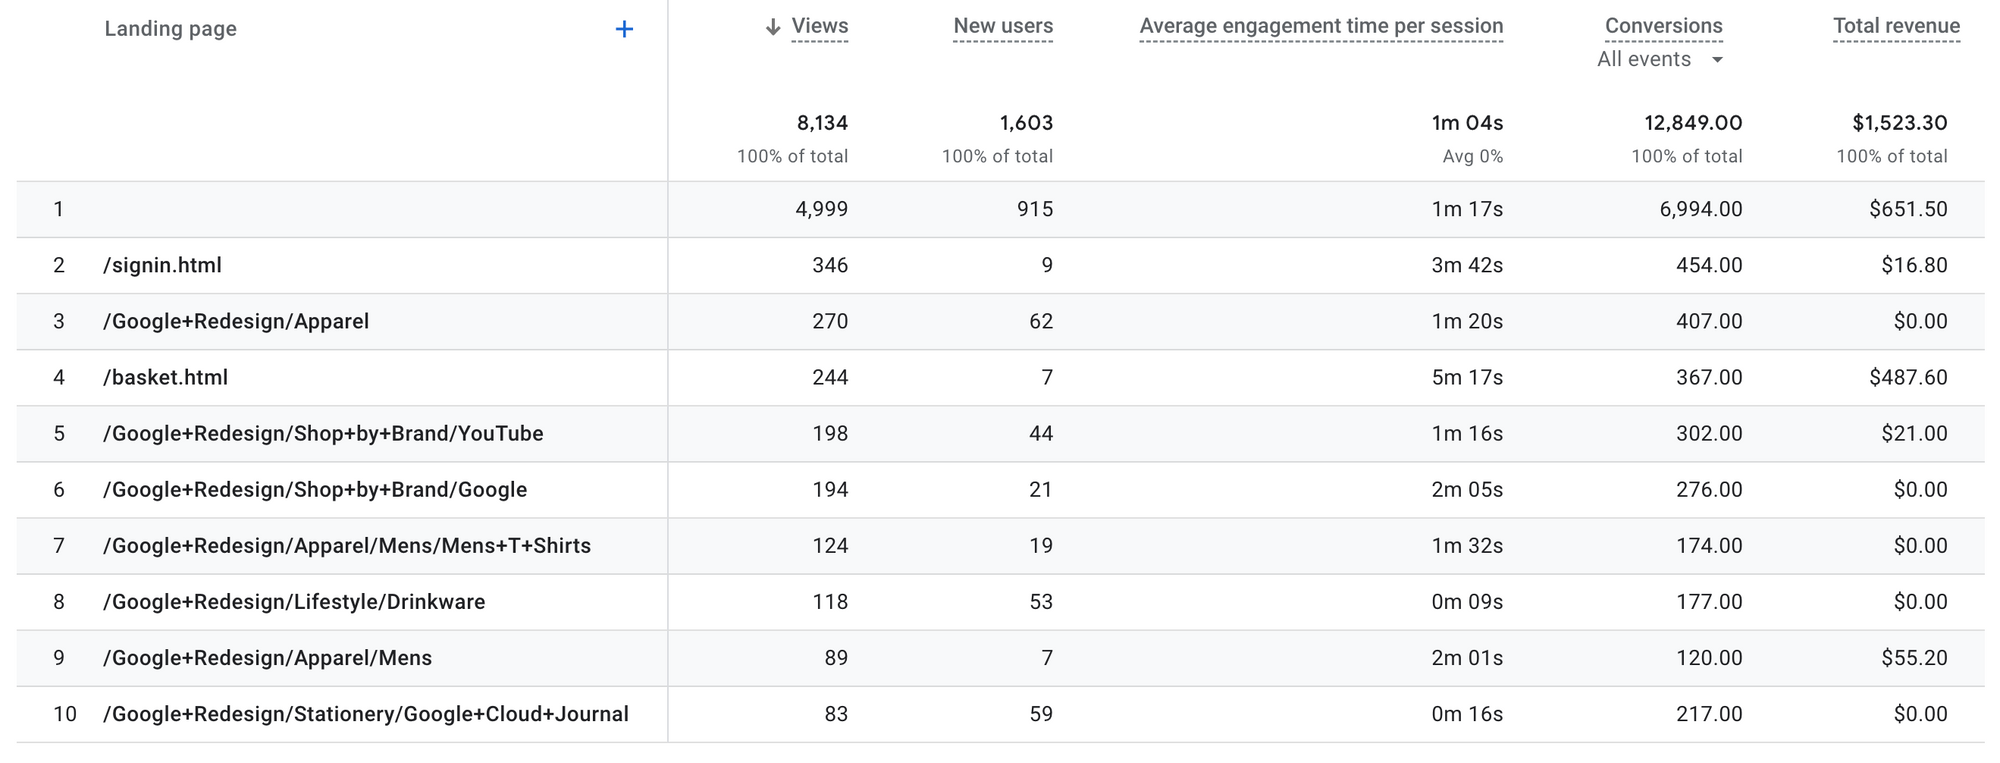
Instead, the landing pages in the GA4 user interface are sorted by Views, provided with this definition:
The number of app screens or web pages your users saw. Repeated views of a single screen or page are counted.
So a landing page can be viewed multiple times in a session and these views will all be counted? At least Views should have been deduplicated to get unique page views, which is a session scope metric.
Users
Let's look at the amount of users then, to see how our landing pages perform. But the only user metric is New users:
The number of users who interacted with your site or launched your app for the first time (event triggered: first_open).
So you're telling me that a landing page will only be counted when a user visits the website for the first time? What about (sessions of) returning visitors?
User engagement
Maybe the next metric will enlighten us. Let's take a look at the definition:
User engagement duration per session.
So now we're suddenly switching to sessions? And are we talking about all sessions here or only considering engaged sessions? Questions, questions...
Some more issues:
- A count of conversions is included in the report, but what about the conversion rate?
- Why is the first landing page blank? Is this the homepage
/? Ornullvalues that need to be excluded? Or both? - Even if you try to match the results from the GA4 user interface, chances are that you'll experience big gaps in numbers (more than usually, at least in my experience)
Let's fix this
You'll get the point. Let's just hope that Google Analytics product team will put some more effort in these reports. In the mean time we can create our own custom landing page report. Because we have all the raw event data at our disposal, we are able to start building right away.
Metrics to include
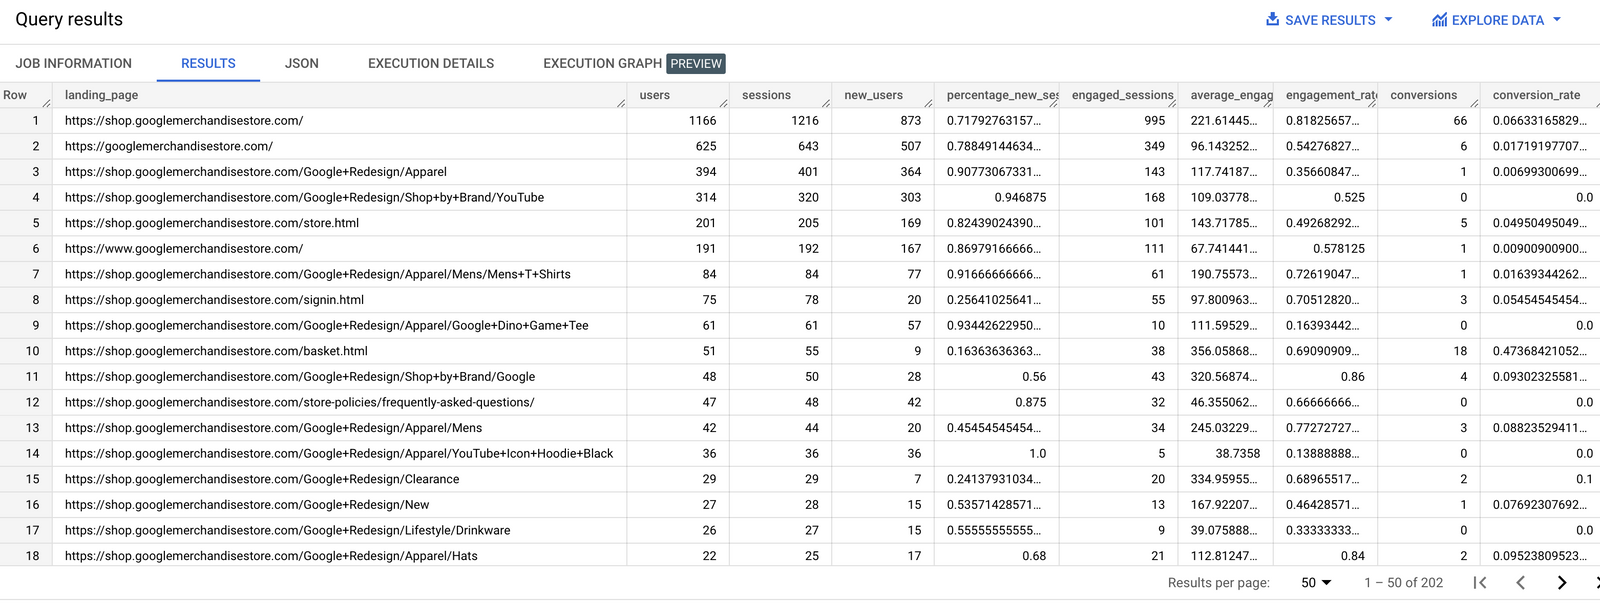
Next to the dimension Landing page we want to include the following metrics (at least they all make sense from a session point of view and all calculations will be transparant):
- users
- new users
- (total) sessions
- % new (total) sessions
- engaged sessions
- average engagement time per session (based on total sessions)
- engagement rate (based on total sessions)
- conversions
- conversion rate (based on total sessions)
Let's query!
In this tutorial, you will learn how to:
- identify the flaws of the current GA4 landing page report
- extract values from the event parameters and sessionize them to prepare for the main query
- calculate metrics such as users, new users, total sessions, engaged sessions, average engagement time per session, engagement rate, conversions, and conversion rate in the main query