GA4 First-Touch Analysis: Which Products Create Your Most Valuable Customers
This article shows how you can analyze the number of visitors and purchasing customers based on which product they see (look for) first in your store, identifying valuable segments with specific product interests.
Editor's note: this article is a guest post by Enio Kurteši with some additions from the editor.
Introduction
When customers land on your website and click on their first product, they start a journey that goes far beyond that initial interaction. Most e-commerce businesses track metrics like conversion rates from product views to purchases, but this approach misses the bigger revenue picture. Many companies overlook that a customer's first product interaction often drives purchasing decisions across multiple future transactions, creating revenue opportunities that standard analytics never capture.
The business impact is significant. Consider finding that customers who first view 'Product A' make an average of 4.2 purchases over six months, while those who first view 'Product B' average only 1.8 purchases. Or discovering that 60% of customers who initially clicked on premium 'Product X' eventually bought them within their first five transactions, while the company's best-selling 'Product Y' only converts in 15% of repeat transactions despite getting more initial clicks.
This analysis helps answer the strategic questions that drive business growth:
- Which products should get prime homepage real estate based on their ability to create valuable customers?
- Where should marketing budgets go to maximize both immediate and long-term revenue?
- Which items deserve top spots in email campaigns and promotional content?
Business Intelligence Gap
The analysis framework we are presenting addresses this gap by tracking customers from their initial product discovery through their complete transaction history. This approach reveals which products serve as effective gateway experiences that drive long-term customer engagement, versus those that generate initial interest but fail to sustain purchasing momentum across multiple transactions.
The Technical Foundation
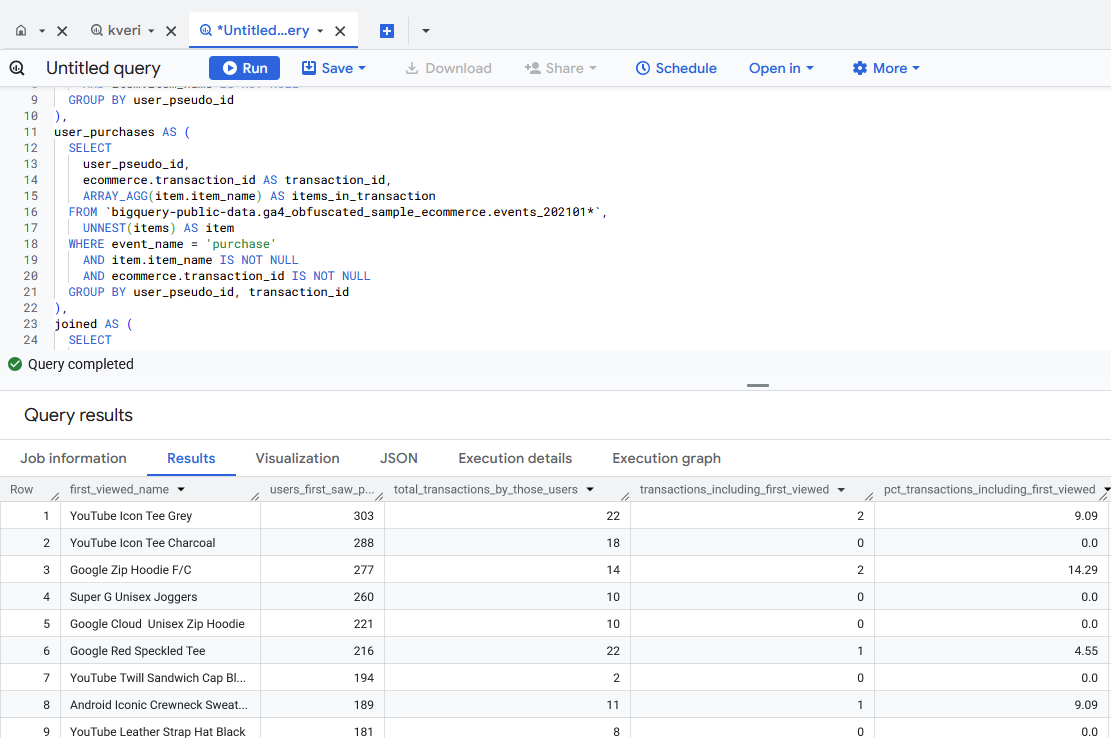
The full query:
WITH first_viewed_product AS (
  SELECT
    user_pseudo_id,
    ARRAY_AGG(item.item_name ORDER BY event_timestamp ASC)[OFFSET(0)] AS first_viewed_name
  FROM `bigquery-public-data.ga4_obfuscated_sample_ecommerce.events_202101*`,
    UNNEST(items) AS item
  WHERE event_name = 'view_item'
    AND item.item_name IS NOT NULL
  GROUP BY user_pseudo_id
),
user_purchases AS (
  SELECT
    user_pseudo_id,
    ecommerce.transaction_id AS transaction_id,
    ARRAY_AGG(item.item_name) AS items_in_transaction
  FROM `bigquery-public-data.ga4_obfuscated_sample_ecommerce.events_202101*`,
    UNNEST(items) AS item
  WHERE event_name = 'purchase'
    AND item.item_name IS NOT NULL
    AND ecommerce.transaction_id IS NOT NULL
  GROUP BY user_pseudo_id, transaction_id
),
joined AS (
  SELECT
    fv.first_viewed_name,
    fv.user_pseudo_id,
    up.transaction_id,
    up.items_in_transaction,
    CASE
      WHEN up.transaction_id IS NOT NULL
           AND fv.first_viewed_name IN UNNEST(up.items_in_transaction)
      THEN 1 ELSE 0
    END AS first_viewed_in_transaction
  FROM first_viewed_product fv
  LEFT JOIN user_purchases up
    ON fv.user_pseudo_id = up.user_pseudo_id
)
SELECT
  first_viewed_name,
  COUNT(DISTINCT user_pseudo_id) AS users_first_saw_product,
  COUNT(DISTINCT transaction_id) AS total_transactions_by_those_users,
  COUNT(DISTINCT CASE WHEN first_viewed_in_transaction = 1 THEN transaction_id END) AS transactions_including_first_viewed,
  ROUND(
    SAFE_DIVIDE(COUNT(DISTINCT CASE WHEN first_viewed_in_transaction = 1 THEN transaction_id END) * 100.0,
                COUNT(DISTINCT transaction_id)),
    2
  ) AS pct_transactions_including_first_viewed
FROM joined
GROUP BY first_viewed_name
ORDER BY users_first_saw_product DESC, pct_transactions_including_first_viewed DESC
The methodology employs a three-stage analytical framework that captures customer journey data. The first stage identifies each customer's authentic first product interaction by chronologically ordering all product view events and extracting the initial item encountered. This foundational step establishes the true starting point for each customer's journey with our product catalog.
CTE first_viewed_product
WITH first_viewed_product AS (
  SELECT
    user_pseudo_id,
    ARRAY_AGG(item.item_name ORDER BY event_timestamp ASC)[OFFSET(0)] AS first_viewed_name
  FROM `bigquery-public-data.ga4_obfuscated_sample_ecommerce.events_202101*`,
    UNNEST(items) AS item
  WHERE event_name = 'view_item'
    AND item.item_name IS NOT NULL
  GROUP BY user_pseudo_id
)
This strategy utilizes BigQuery’s array aggregation functions to accurately determine the true first-touch events in time sequence. Sorting events by their timestamps ensures clarity on which product actually initiated each customer’s journey, establishing a trustworthy framework for downstream analysis.
The following phase then captures detailed purchase behavior at the transaction level, using real transaction identifiers.
CTE user_purchases
 user_purchases AS (
  SELECT
    user_pseudo_id,
    ecommerce.transaction_id AS transaction_id,
    ARRAY_AGG(item.item_name) AS items_in_transaction
  FROM `bigquery-public-data.ga4_obfuscated_sample_ecommerce.events_202101*`,
    UNNEST(items) AS item
  WHERE event_name = 'purchase'
    AND item.item_name IS NOT NULL
    AND ecommerce.transaction_id IS NOT NULL
  GROUP BY user_pseudo_id, transaction_id
)
Using real transaction identifiers guarantees that complex, multi-item purchases are accurately grouped and analyzed as unified transactions. This level of technical precision is important for calculating transaction-level conversion rates and evaluating cross-sell performance within each purchase event.
CTE joined
joined AS (
  SELECT
    fv.first_viewed_name,
    fv.user_pseudo_id,
    up.transaction_id,
    up.items_in_transaction,
    CASE
      WHEN up.transaction_id IS NOT NULL
           AND fv.first_viewed_name IN UNNEST(up.items_in_transaction)
      THEN 1 ELSE 0
    END AS first_viewed_in_transaction
  FROM first_viewed_product fv
  LEFT JOIN user_purchases up
    ON fv.user_pseudo_id = up.user_pseudo_id
)
The third stage connects first-touch data with subsequent purchase behavior through a LEFT JOIN operation that preserves all customers in the analysis, regardless of their eventual purchase status. This inclusive approach prevents the analytical bias that occurs when only converted customers are included in conversion rate calculations.
The matching logic employs BigQuery's IN operator and the UNNEST() function to efficiently search within transaction item arrays, identifying when the originally viewed product appears in subsequent purchases. This binary flagging system enables precise tracking of first-touch product performance across complex, multi-item purchasing scenarios.
Final Output
SELECT
  first_viewed_name,
  COUNT(DISTINCT user_pseudo_id) AS users_first_saw_product,
  COUNT(DISTINCT transaction_id) AS total_transactions_by_those_users,
  COUNT(DISTINCT CASE WHEN first_viewed_in_transaction = 1 THEN transaction_id END) AS transactions_including_first_viewed,
  ROUND(
    SAFE_DIVIDE(COUNT(DISTINCT CASE WHEN first_viewed_in_transaction = 1 THEN transaction_id END) * 100.0,
                COUNT(DISTINCT transaction_id)),
    2
  ) AS pct_transactions_including_first_viewed
FROM joined
GROUP BY first_viewed_name
ORDER BY users_first_saw_product DESC, pct_transactions_including_first_viewed DESC
The final analytical output delivers four business intelligence metrics that provide insight into product performance and customer behavior patterns.
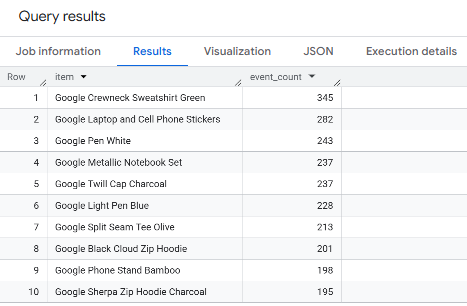
The total audience metric (users_first_saw_product) establishes the complete reach of each product as an entry point to your brand. This measurement reveals which products are most effective at attracting initial customer attention and serves as the denominator for all subsequent conversion calculations.
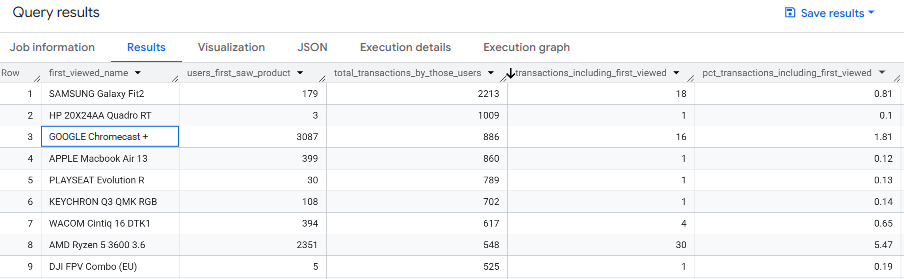
The transaction volume measurement (total_transactions_by_those_users) quantifies the complete purchasing activity generated by customers who first encountered each specific product. This metric demonstrates the downstream revenue impact of different first-touch experiences and helps identify products that successfully drive ongoing customer engagement.
The conversion transaction count (transactions_including_first_viewed) measures the specific instances where the originally viewed product appeared in subsequent purchases. This direct conversion tracking reveals which products successfully transition from initial interest to actual revenue generation.
The transaction-level conversion rate (pct_transactions_including_first_viewed) represents the most insightful metric in this analysis. This metric indicates the share of all transactions from first-touch customers that contained the initially viewed product, offering visibility into product stickiness and the potential for repeat purchases.
Product managers can identify which items serve as the most effective gateway experiences for new customers, informing strategic decisions about homepage placement, featured product positioning, and new customer onboarding flows.
Marketing teams gain visibility into which products generate the highest lifetime value when they serve as first-touch experiences. This intelligence enables better campaign targeting, where marketing spend is allocated based on long-term customer value generation rather than immediate conversion rates alone.
Products that demonstrate high first-touch audience reach combined with strong transaction-level conversion rates deserve prioritized inventory investment, while products that attract initial interest but show poor downstream conversion may require pricing optimization, product description enhancement, or repositioning strategies.
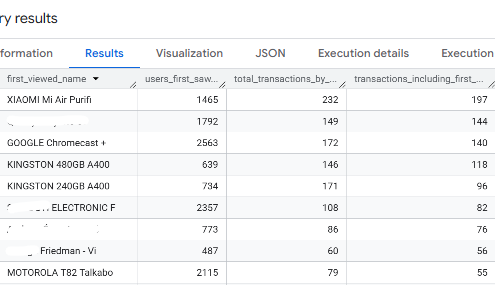
Editor's note: when you sort this table by one of the other columns, the output becomes even more interesting: for example, you can get a view of items that were the first product seen by the most prolific buyers.
Of course, correlation isn't causation and this doesn't mean that seeing these products caused that volume of transactions. But (1) it is worth investigating, (2) the first product viewed might be an indicator of customer type as to what sort of products those customer is interested in. In other words, you may be able to identify high value customer segments based on the type of products they look for at first when visiting your online store.
Conclusion
Now it’s your turn! Let us know if you tried this approach or if you have a preferred method for tackling similar challenges.
Happy analyzing!
Post-note:
We have just published another free article about identifying products (from the GA4 items array) that frequently co-occur with other products in the cart and therefore are good "supporting" products to promote. Check it out here: