Uncovering Cross-Selling Gold: How to Analyze Multi-Item Purchase Patterns
This article shows how to uncover deeper patterns in GA4 cart data: namely to identify "supporting" products which often appear alongside other products in the cart, thereby being secondary revenue drivers.
Editor's note: this article is a guest post by Enio Kurteši.
E-commerce success increasingly depends on understanding the hidden patterns within customer transactions. While most businesses focus on analyzing which individual products sell best, the most valuable insights emerge from identifying the "unseen heroes" - those products that customers consistently choose as companions to their main purchases. These supporting products rarely steal the spotlight in sales reports, yet they play important roles in customer satisfaction and revenue optimization.
The Business Case: Identifying Your Product Ecosystem's Supporting Players
Consider a typical online retailer with diverse product offerings. While knowing that Product X is their top-selling item provides basic insights, discovering which products consistently appear as supporting purchases alongside various main items shows the real picture of customer needs. These supporting products - let's call them Product Y, Product Z, and Product W - might not top the sales charts, but they frequently appear in multi-item baskets, acting as helpful companions that complete the customer's shopping needs.
First, understanding these supporting product patterns allows businesses to craft bundling strategies that truly reflect customer behavior. Instead of randomly pairing bestsellers together, retailers can identify which products naturally work well together in customer purchases, creating bundles that feel right and valuable to shoppers.
Second, inventory management becomes smarter. When you see that Product B and Product C consistently act as supporting purchases to various main products, you understand their role as "helper products" - items that might have modest individual sales but are important for keeping customers happy and preventing lost sales.
The Technical Solution: GA4 and BigQuery
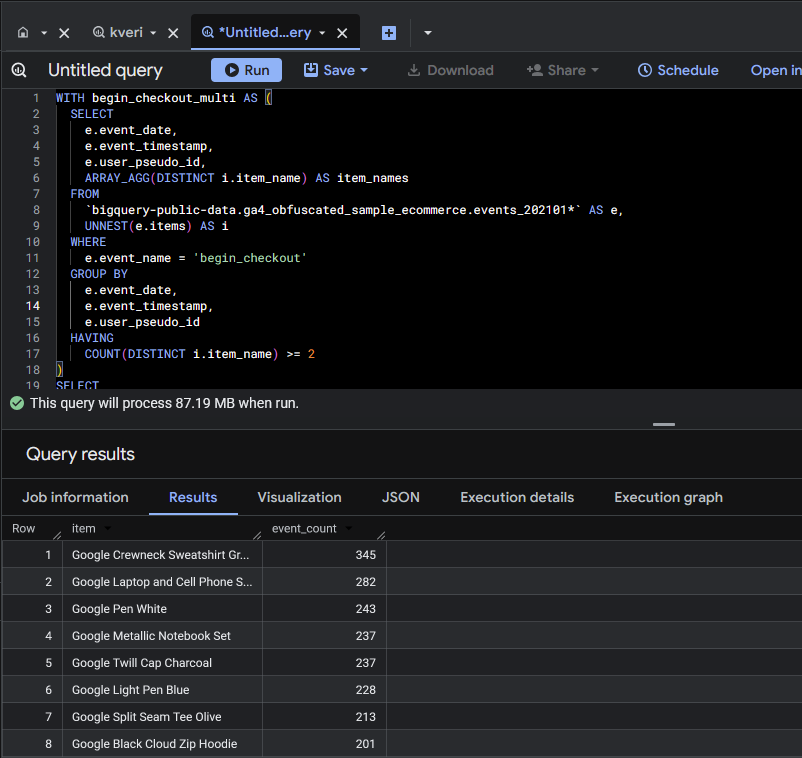
Google Analytics 4 paired with BigQuery provides the perfect foundation for this analysis. The following SQL query demonstrates how to identify these supporting products - the items that most frequently appear in multi-item checkout events alongside other products, revealing which products serve as essential companions in the customer purchase ecosystem.
WITH begin_checkout_multi AS (
  SELECT
    e.event_date,
    e.event_timestamp,
    e.user_pseudo_id,
    ARRAY_AGG(DISTINCT i.item_name) AS item_names
  FROM
    `bigquery-public-data.ga4_obfuscated_sample_ecommerce.events_202101*` AS e,
    UNNEST(e.items) AS i
  WHERE
    e.event_name = 'begin_checkout'
  GROUP BY
    e.event_date,
    e.event_timestamp,
    e.user_pseudo_id
  HAVING
    COUNT(DISTINCT i.item_name) >= 2
)
SELECT
  item,
  COUNT(*) AS event_count
FROM
  begin_checkout_multi,
  UNNEST(item_names) AS item
GROUP BY
  item
ORDER BY
  event_count DESC
LIMIT 10;
Breaking Down the Analysis:
The query begins by creating a Common Table Expression called begin_checkout_multi, which serves as the foundation for our analysis. This CTE focuses specifically on checkout events where customers have multiple distinct items in their cart, filtering out single-item purchases that don't provide cross-selling insights.
The data source utilizes the BigQuery public dataset for GA4 e-commerce events, specifically targeting January 2021 data through the wildcard pattern events_202101*. This approach allows the analysis to process multiple daily event tables simultaneously, providing a view of customer behavior across the entire month.
Within the CTE, we select key event identifiers including the event_date, event_timestamp and user_pseudo_id.
The UNNEST(e.items) operation is important for this analysis because GA4 stores item information in nested arrays within each event record. By unnesting this array, we transform each begin_checkout event with multiple items into multiple rows.
The ARRAY_AGG(DISTINCT i.item_name) function reconstructs the relationship between items within the same checkout event. After unnesting items into separate rows, this aggregation function collects all distinct item names back into an array, but now we have them grouped by the unique checkout identifiers.
The WHERE clause filters specifically for 'begin_checkout' events, ensuring we're analyzing customer intent at the moment they decide to purchase, rather than just browsing behavior.
The GROUP BY clause ensures that we're aggregating data using all the event identifiers to maintain the integrity of each unique transaction start. This grouping is essential for accurately counting distinct items within each checkout attempt.
The HAVING clause applies a filter by requiring COUNT(DISTINCT i.item_name) >= 2, which ensures we only include checkouts where customers have at least two different products. This filter is fundamental to our cross-selling analysis because single-item checkouts don't provide insights into product relationships.
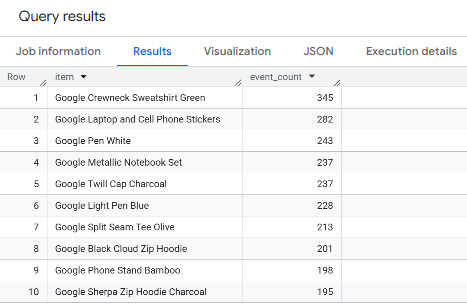
The final GROUP BY item and COUNT(*) AS event_count aggregation reveals how frequently each product plays a supporting role across all multi-item checkout events. Products with higher counts indicate items that customers consistently choose as companions to other purchases, identifying them as key supporting players in your product ecosystem rather than standalone bestsellers.
The ORDER BY event_count DESC LIMIT 10 clause presents the results in a business-friendly format, revealing the top ten supporting products - those items that most commonly serve as companions in multi-item purchases, ranked by their frequency as supporting players rather than their individual sales volume.
The results of this analysis provide a foundation for multiple strategic initiatives. E-commerce teams can use these insights to design product recommendation engines that suggest complementary items based on real customer behavior rather than simple popularity metrics.
Marketing teams can use this data to create more effective email campaigns, featuring products that customers demonstrably purchase together, leading to higher engagement rates and conversion rates. The insights also inform promotional strategies, such as offering discounts on complementary items to encourage larger basket sizes.
Inventory management teams benefit from understanding these relationships, enabling them to coordinate stock levels for related products and prevent situations where popular complementary items are out of stock when customers want to purchase them together.
Product development teams can identify unexpected product relationships that might inform new product creation or modifications to existing products that better serve customer needs revealed through their purchasing patterns.
Conclusion
The beauty of using GA4 and BigQuery for this analysis lies in the scalability and flexibility of the approach. The same query structure can be modified to analyze different time periods, focus on specific product categories, or examine various customer segments, providing ongoing insights that evolve with business needs. You can try running a similar query on your own GA4 export dataset to uncover which products tend to be purchased together, or tweak it to answer questions more specific to your business. And if you’ve developed your own favorite way of exploring multi-item checkouts, feel free to share your approach in the comments, it’s always valuable to compare different perspectives.
Happy analyzing!
