Analyze the Recovery Time of Checkout Abandoners
This article is an example of using more sophisticated logic on GA4 data to identify value levers based on customer behavior for e-commerce companies. The full content of this article (including the SQL code) is available for free.
Editor's note: this article is a guest post by Enio Kurtesi, originally published on LinkedIn. It is now also released here in its entirety and its original form without changes, except for some formatting, additional comments marked with quotes (like this very paragraph) or callout boxes (those with the lightbulb which you can see in other articles), or my own screenshots as I tried this out. You can check out Enio's LinkedIn profile here, and through that, a lot of his other work. I'd like to hereby thank him for agreeing to publish his article on the GA4BigQuery platform. Content on LinkedIn—albeit still accessible with the right URL—tends to disappear into the "abyss" in a relatively short time, and I thought this one was worth saving "permanently".
Now, over to Enio below.
When customers start the checkout process but don't complete their purchase, they represent a valuable opportunity, these aren't casual browsers but people who've shown clear purchase intent by entering the final stage of your conversion funnel.
Without proper analysis of customer recovery patterns, you might be sending discount emails too early, missing the optimal re-engagement window, or worse, annoying customers who were already planning to return naturally.
Key questions that standard analytics can't answer:
- When do these customers typically return?
- Do they come back at all without intervention?
- How long should you wait before offering discounts?
- Which abandoners are worth investing marketing dollars to win back?
- What's your natural recovery rate versus intervention-driven recovery?
Editor's note (I'll try to minimize these to avoid disrupting the flow—but cannot help pointing out is that): asking the right questions is half the battle. Would love to get some feedback around what sort of complex analysis has worked well for you, or what question you have come across that you think can be answered with the GA4 BigQuery export.
In today's article, I'll walk you through a SQL analysis that extracts the actual behavioral patterns hidden in your GA4 data. You'll learn how to calculate your natural recovery rate, identify optimal retargeting timing, and understand exactly when checkout abandoners are most likely to return to complete their purchase.
Understanding the GA4 Event Data Structure
GA4 uses an event-driven model where every user interaction becomes a distinct event record. When exported to BigQuery, this creates a dataset where each row represents a single event, complete with user identifiers, timestamps, and nested parameters containing additional context. This structure enables us to reconstruct complete customer journeys with a level of precision that standard reporting interfaces cannot offer. We can trace individual users from abandonment to eventual purchase, measuring the exact time intervals between these key events.
SQL Code
WITH

  ga4_events AS (
    SELECT
      user_pseudo_id,
      event_name,
      TIMESTAMP_MICROS(event_timestamp) AS event_ts,
      (SELECT value.int_value FROM UNNEST(event_params) WHERE key = 'ga_session_id') AS ga_session_id
    FROM
      `bigquery-public-data.ga4_obfuscated_sample_ecommerce.events_*`
    WHERE
       event_name IN ('begin_checkout', 'purchase')
      AND EXISTS (SELECT 1 FROM UNNEST(event_params) WHERE key = 'ga_session_id')
  ),

  -- Sessions with event flags per user per session
  session_events AS (
    SELECT
      user_pseudo_id,
      ga_session_id,
      MIN(event_ts) AS session_start_ts,
      MAX(CASE WHEN event_name = 'begin_checkout' THEN 1 ELSE 0 END) AS has_begin_checkout,
      MAX(CASE WHEN event_name = 'purchase' THEN 1 ELSE 0 END) AS has_purchase
    FROM ga4_events
    GROUP BY user_pseudo_id, ga_session_id
  ),

  -- Identify abandonment sessions: sessions with begin_checkout but no purchase
  abandonment_sessions AS (
    SELECT
      user_pseudo_id,
      ga_session_id,
      session_start_ts AS abandon_ts
    FROM session_events
    WHERE has_begin_checkout = 1 AND has_purchase = 0
  ),

  -- For each user, find the earliest abandonment session timestamp
  first_abandonment AS (
    SELECT
      user_pseudo_id,
      ga_session_id AS abandon_session_id,
      abandon_ts
    FROM (
      SELECT
        user_pseudo_id,
        ga_session_id,
        abandon_ts,
        ROW_NUMBER() OVER (PARTITION BY user_pseudo_id ORDER BY abandon_ts ASC) AS rn
      FROM abandonment_sessions
    )
    WHERE rn = 1
  ),

  -- Find all purchase sessions
  purchase_sessions AS (
    SELECT
      user_pseudo_id,
      ga_session_id,
      session_start_ts AS purchase_ts
    FROM session_events
    WHERE has_purchase = 1
  ),

  -- For each user, find the earliest purchase session after the FIRST abandonment session
  purchase_after_first_abandonment AS (
    SELECT
      fa.user_pseudo_id,
      fa.abandon_session_id,
      fa.abandon_ts,
      MIN(ps.purchase_ts) AS purchase_ts
    FROM first_abandonment fa
    JOIN purchase_sessions ps
      ON fa.user_pseudo_id = ps.user_pseudo_id
      AND ps.purchase_ts > fa.abandon_ts
    GROUP BY fa.user_pseudo_id, fa.abandon_session_id, fa.abandon_ts
  ),

  -- Calculate days difference per user
  user_days_diff AS (
    SELECT
      user_pseudo_id,
      abandon_ts,
      purchase_ts,
      DATE_DIFF(DATE(purchase_ts), DATE(abandon_ts), DAY) AS days_between
    FROM purchase_after_first_abandonment
  )

-- Final
SELECT
  (SELECT COUNT(*) FROM first_abandonment) AS total_abandoners,
  COUNT(DISTINCT user_pseudo_id) AS users_with_abandonment_and_return,
    ROUND((COUNT(DISTINCT user_pseudo_id) * 100.0) / (SELECT COUNT(*) FROM first_abandonment), 2) AS recovery_rate_percent,
    100 - ROUND((COUNT(DISTINCT user_pseudo_id) * 100.0) / (SELECT COUNT(*) FROM first_abandonment), 2) as churn_rate_percent,
  AVG(days_between) AS avg_days_to_return_purchase,
  MIN(days_between) AS min_days_to_return,
  MAX(days_between) AS max_days_to_return,
FROM user_days_diff;
Let's go step by step and explain each part of the code.
Extracting Core GA4 Events
-- Base GA4 events
ga4_events AS (
  SELECT
    user_pseudo_id,
    event_name,
    TIMESTAMP_MICROS(event_timestamp) AS event_ts,
    (SELECT value.int_value FROM UNNEST(event_params) WHERE key = 'ga_session_id') AS ga_session_id
  FROM
    `bigquery-public-data.ga4_obfuscated_sample_ecommerce.events_*`
  WHERE
    event_name IN ('begin_checkout', 'purchase')
    AND EXISTS (SELECT 1 FROM UNNEST(event_params) WHERE key = 'ga_session_id')
)
Our first step focuses on extracting the two most important events for abandonment analysis: "begin_checkout" and "purchase". The "begin_checkout" event fires when users start the checkout process, indicating clear purchase intent, while the "purchase" event marks successful transaction completion.
The UNNEST(event_params) function is important here because GA4 stores additional event information in a nested array structure rather than flat columns. Each event can have multiple parameters stored as key-value pairs, and we need to extract the session ID to properly group related events together.
session_events CTE
 session_events AS (
  SELECT
    user_pseudo_id,
    ga_session_id,
    MIN(event_ts) AS session_start_ts,
    MAX(CASE WHEN event_name = 'begin_checkout' THEN 1 ELSE 0 END) AS has_begin_checkout,
    MAX(CASE WHEN event_name = 'purchase' THEN 1 ELSE 0 END) AS has_purchase
  FROM ga4_events
  GROUP BY user_pseudo_id, ga_session_id
)
This CTE transforms our event-level data into session-level insights since we want to analyze abandonment patterns at the session level. The unique combination of user_pseudo_id and ga_session_id gives us individual sessions in GA4 BigQuery.
The MIN(event_ts) calculation captures the earliest timestamp for each session, giving us a reliable session start time that we can use for temporal analysis later. The conditional CASEstatements combined with MAX functions create boolean flags that indicate whether each session contained our events of interest. Since MAX returns the highest value in a group, and our CASE statements return either 1 or 0, this approach effectively creates flags showing whether checkout initiation or purchase completion occurred during each session.
Identifying Abandonment Sessions
-- sessions with begin_checkout but no purchase
abandonment_sessions AS (
  SELECT
    user_pseudo_id,
    ga_session_id,
    session_start_ts AS abandon_ts
  FROM session_events
  WHERE has_begin_checkout = 1 AND has_purchase = 0
)
This CTE filters our session data to identify only those sessions where users initiated checkout but didn't complete a purchase. These sessions represent our target audience for recovery analysis.
First-Time Abandonment
-- For each user, find the earliest abandonment session timestamp
first_abandonment AS (
  SELECT
    user_pseudo_id,
    ga_session_id AS abandon_session_id,
    abandon_ts
  FROM (
    SELECT
      user_pseudo_id,
      ga_session_id,
      abandon_ts,
      ROW_NUMBER() OVER (PARTITION BY user_pseudo_id ORDER BY abandon_ts ASC) AS rn
    FROM abandonment_sessions
  )
  WHERE rn = 1
)
The ROW_NUMBER() window function partitioned by user_pseudo_id and ordered by abandonment timestamp assigns a sequential number to each user's abandonment events. By filtering for rn = 1, we capture only the earliest abandonment event for each user, creating a cleaner dataset for subsequent analysis.
QUALIFY statement:QUALIFY ROW_NUMBER() OVER (PARTITION BY user_pseudo_id ORDER BY abandon_ts ASC) = 1This saves us having to create an extra CTE and makes the code easier to read.
Find All Purchase Sessions
-- Find all purchase sessions
purchase_sessions AS (
  SELECT
    user_pseudo_id,
    ga_session_id,
    session_start_ts AS purchase_ts
  FROM session_events
  WHERE has_purchase = 1
)
Matching Abandonment with Recovery
-- For each user, find the earliest purchase session after the FIRST abandonment session
purchase_after_first_abandonment AS (
  SELECT
    fa.user_pseudo_id,
    fa.abandon_session_id,
    fa.abandon_ts,
    MIN(ps.purchase_ts) AS purchase_ts
  FROM first_abandonment fa
  JOIN purchase_sessions ps
    ON fa.user_pseudo_id = ps.user_pseudo_id
    AND ps.purchase_ts > fa.abandon_ts
  GROUP BY fa.user_pseudo_id, fa.abandon_session_id, fa.abandon_ts
)
Here we connect abandonment events with eventual purchases. The join condition ps.purchase_ts > fa.abandon_ts ensures we only consider purchases that occurred after the abandonment event, establishing clear relationships between abandonment and recovery.
The MIN(ps.purchase_ts) aggregation is important because it identifies the first purchase following abandonment. If a customer makes multiple purchases after abandoning their first cart, we want to measure the time to their initial recovery, not their most recent purchase.
Calculating Time-to-Recovery Metrics
-- Calculate days difference per user
user_days_diff AS (
  SELECT
    user_pseudo_id,
    abandon_ts,
    purchase_ts,
    DATE_DIFF(DATE(purchase_ts), DATE(abandon_ts), DAY) AS days_between
  FROM purchase_after_first_abandonment
)
By converting both timestamps to DATE type before calculating the difference, we get clean, whole-day measurements that are easy to interpret.
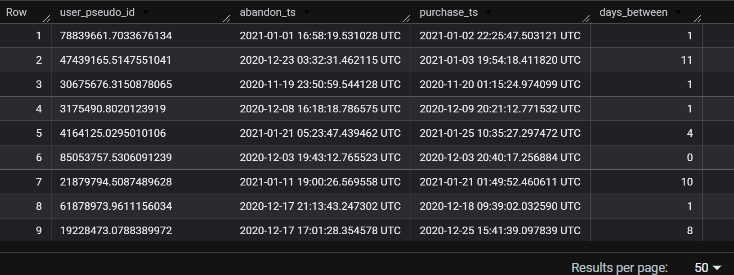
Editor's note: let's stop here for a second, before proceeding to the final output. The output of this CTE provides the abandonment and return by user, i.e. a full user list which you can then filter down into lists of users who return on the same day or the next day, or those who take a long time to return (possibly with a different cart by that time, so they've effectively abandoned their original one). In other words, you can create audiences this way, which you can then either analyze further, or use in other smart ways e.g. load them into Google Ads for remarketing, or launch email campaigns to help them on their journey.
Screenshot here:
Final
SELECT
(SELECT COUNT(*) FROM first_abandonment) AS total_abandoners,
COUNT(DISTINCT user_pseudo_id) AS users_with_abandonment_and_return,
ROUND((COUNT(DISTINCT user_pseudo_id) * 100.0) / (SELECT COUNT(*) FROM first_abandonment), 2) AS recovery_rate_percent,
100 - ROUND((COUNT(DISTINCT user_pseudo_id) * 100.0) / (SELECT COUNT(*) FROM first_abandonment), 2) as churn_rate_percent,
AVG(days_between) AS avg_days_to_return_purchase,
MIN(days_between) AS min_days_to_return,
MAX(days_between) AS max_days_to_return,
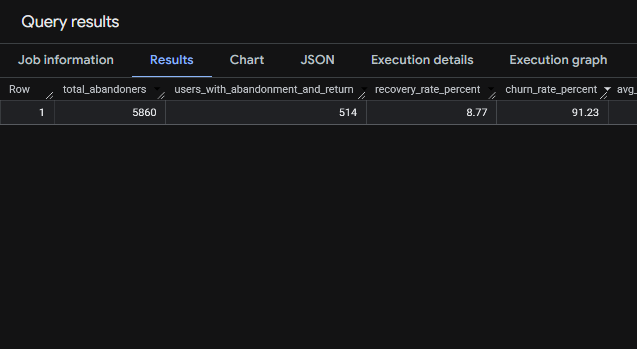
FROM user_days_diff;This query calculates key metrics related to users who abandoned their checkout and later made a purchase. It shows the total number of abandoners, how many returned to complete a purchase, the recovery and churn rates as percentages, and the average, minimum, and maximum number of days it took for users to return and buy.

What's your biggest challenge with cart abandonment recovery analysis?
I'd love to hear about your experiences and the strategies that have worked (or haven't worked) for your use cases! :)
Thank you for reading!
Editor's note: although it's interesting enough to try it on the standard GA4 dataset, it really comes to life when one tries it with their own clients' data. Here it is for one of ours:
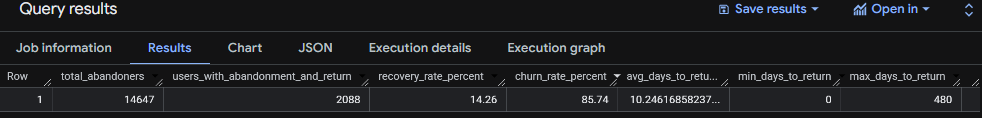
In this case, the recovery rate is a lot better (14% instead of 9%): it is a health store in this case; really interesting to compare multiple clients in this regard.
Also, there is even more to unpack when we think it further and we want to measure the full impact of cart abandonment, by not only taking the first one for each customer, but including all of them. It requires splitting the users' timeline into journeys, and then analyzing this thing on a journey level. We might also consider more sophisticated rules around cart content to make sure it is the same cart that the user returns to and tweaks before purchasing. Of course the logic will get a lot more complex at this point, so this tutorial tries to keep things "basic" to get the core methodology across.
Now it's your turn!
I hope you've enjoyed this tutorial and feel a bit more confident to utilise your own Google Analytics data in BigQuery. Drop a line in the comments if you have any questions, feedback or suggestions related to this article.
Reclaim a significant amount of your valuable time by subscribing to our premium membership. You'll gain immediate access to 23 similar tutorials with SQL code and 7 ready-to-go GA4 report queries.
