Understanding the Google Ads BigQuery Data Transfer
The BigQuery Data Transfer for Google Ads is a fantastic way to extract and leverage its underlying data, in many ways superior to 3rd party tools. This article helps you find your way around the maze of >200 database objects it creates, so that you can extract value from it much quicker.
Organizations who spend a lot on advertising platforms — particularly Google Ads — eventually outgrow the standard and custom reporting embedded in the platform itself. At first, one might get away with manually scraping certain data elements into Google Sheets and do the reporting from there, or building Data Studio (formerly Looker Studio, formerly Data Studio 😖) dashboards by connecting to Google Ads directly, but eventually the need arises to extract this data into the organization's own data ecosystem, and get the data engineering / BI people's hands on it.
While some teams opt for creating their own API connector, most companies or users pick a SaaS ELT tool to do this automatically. There are hundreds of such tools out there, some more famous than others (with definitely a big variance in pricing as well), and while this is a valid option, there is a severely underutilized and underappreciated tool in the market: the BigQuery Data Transfer for Google Ads.
Since several popular ELT tools have significantly raised prices and may continue to do so (and others are likely to follow suit), it's about time to look at this free option, especially (but not only!) if your organization already uses BigQuery in any capacity.
This article covers the following:
- Introduction (pros and cons)
- Getting your head around the dataset (using the information schema) — with an "accelerator" for premium subscribers
- Tables or views?
- The 7+1 tables you'll ever need
- The most useful reporting tables
- Reference tables and how (not) to use them
- The GCLID table
- Table categories and entity granularities
- The most important fields across the different tables
- Reconciliation with Google Ads
The pros and cons of the Google Ads Data Transfer
I've been routinely using this data transfer for >6 years now (as of summer 2026), and I've been wondering throughout why it hasn't been adopted more widely, despite these three major perks:
- it's free (and the data is not that big either i.e. storage and/or querying costs are negligible)
- only takes a few minutes to set up (tutorial here if needed)
- it pretty much has all the data one would ever need from Google Ads (especially now that you can also create a custom transfer)
I think the reason people don't use it much comes down to the combination of these two factors:
- the crazy big "schema" it creates: >200 database objects (half of which are views on equivalent tables; more on this further down) — a proper "maze" at first
- not a lot of easily digestible documentation around it (attempting to change that now 😉).
A more detailed pros & cons list has been written up by our friends at GA4Dataform (also known as Superform Labs):
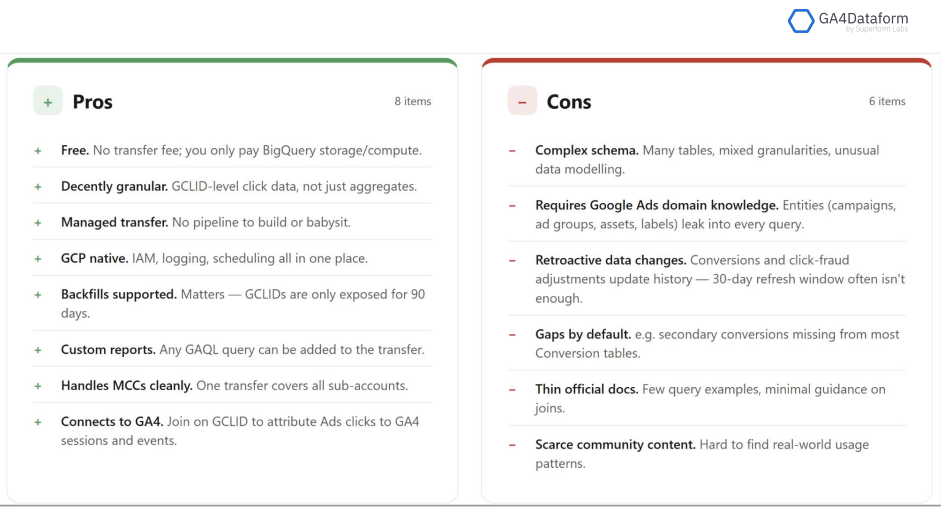
We'll address some of these in this article. Another drawback is the relatively slow backfill when you need a longer historical period of data, and you need it "right now" — fortunately, there is a workaround using the cloud shell for that one.
The transfer schema at a glance
As mentioned above, the transfer — when including all the tables — creates 218 database objects. Even scrolling through them is tiring enough. The good news is that half of these are source tables, all named with a p_ads_ prefix, and half of them are simply views on these tables. So you "only" need to navigate 109 tables.
It can still be daunting, so let's dive in.
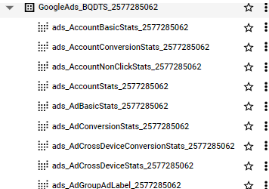
First, a disclaimer: this dataset is not a proper "schema". Don't look for a lot of structure here, and expect joins across many tables to get "the holistic view you want". Instead, it's more like a "dump of many aggregated tables", each one serving a particular purpose, with a given granularity (dimension bundle) and set of metrics to go with it. Occasionally, you might need / be able to join specific tables (e.g. the reference tables with e.g. campaign names, keywords etc), but it's not a "star schema" or anything like that. For a given reporting / data processing task, you usually just need to find the one table that has the exact information you're looking for. (If you cannot find it, you still have the custom load option.)
One of the first things we can do is to list out all the tables and/or columns contained in this "schema", via querying either the INFORMATION_SCHEMA or the hidden __TABLES__ object:
SELECT * FROM `projectname.GoogleAds_BQDTS_1234567890.INFORMATION_SCHEMA.TABLES`;
SELECT * FROM `projectname.GoogleAds_BQDTS_1234567890.__TABLES__`;
SELECT * FROM `projectname.GoogleAds_BQDTS_1234567890.INFORMATION_SCHEMA.COLUMNS`;
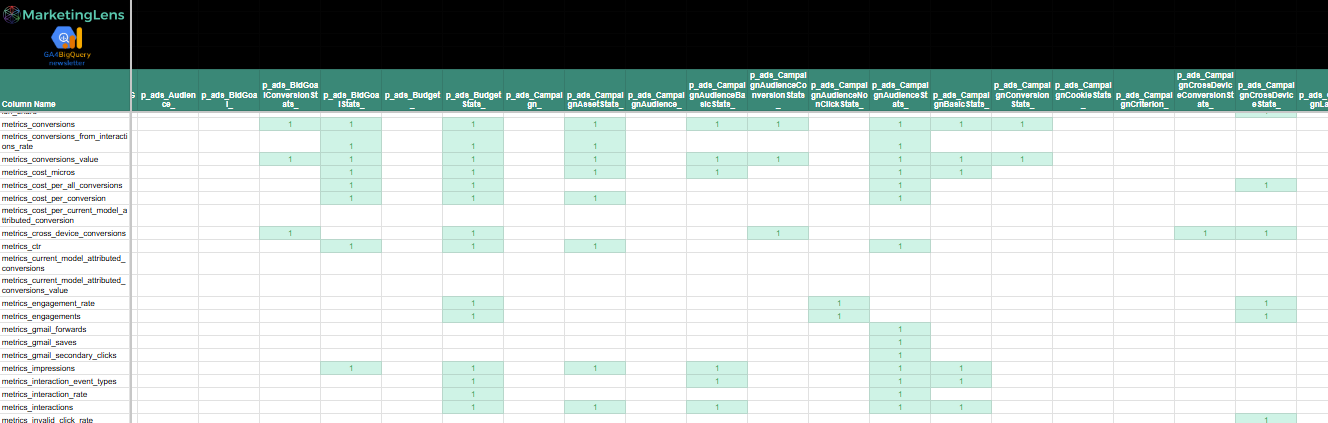
The output is vast, but it's easier to navigate than scrolling in the BigQuery UI. The other benefit of outputting the result of these queries is that we can arrange the output in a matrix (basically, pivot table), to show which types of tables tend to contain what type of columns.
When I first had to deal with the Google Ads transfer, this helped me tremedously to get my head around it.
We'll have a proper look at the different "types" of tables further below. And to save the hassle of adapting it to one of your own datasets, I'll also provide a link to the below spreadsheet for premium subscribers.
Note: you can also pull the INFORMATION_SCHEMA.COLUMNS output into Data Studio for exploring, if you follow this old, but evergreen article.
